
Scenario Results#
Several policy scenarios are simulated using the numerical optimization methods presented, these are summarized in Table 8.
Tip
Every scenario in this section can be reproduced with the scripts of the
optimization examples gallery: the run_*.py
scripts re-run each optimization, and the plot_compare_*.py scripts regenerate the
comparison figures from the pre-computed optima shipped with the repository.
Scenario name |
Background scenario |
Demand saturation |
Traffic aversion |
Policy objective (min) |
Energy carriers |
Tech scenarios |
|
|---|---|---|---|---|---|---|---|
Baseline SSP1 |
SSP1-1.9 |
Trend -10% |
Cumulative CO2 |
Jet-A (fossil) |
Lower, Mid, Upper |
||
Baseline SSP2 |
SSP2-2.6 |
Trend |
Cumulative CO2 |
Jet-A (fossil) |
Lower, Mid, Upper |
||
Baseline SSP5 |
SSP5-4.5 |
Trend +50% |
Cumulative CO2 |
Jet-A (fossil) |
Lower, Mid, Upper |
||
Drop-in trend |
SSP2-2.6 |
Trend |
Cumulative CO2 |
Jet-A (fossil+SAF) |
5.0 |
Lower, Mid, Upper |
|
Drop-in availability |
SSP2-2.6 |
Trend |
Cumulative CO2 |
Jet-A (fossil+SAF) |
8.6 |
Lower, Mid, Upper |
|
Drop-in low-demand |
SSP2-2.6 |
Trend |
✓ |
Rel. price increase |
Jet-A (fossil+SAF) |
5.0 |
Lower, Mid, Upper |
Breakthrough trend |
SSP2-2.6 |
Trend |
Cumulative CO2 |
Jet-A (fossil+SAF), LH2, Battery |
5.0 |
Lower, Mid, Upper |
|
Breakthrough availability |
SSP2-2.6 |
Trend |
Cumulative CO2 |
Jet-A (fossil+SAF), LH2, Battery |
8.6 |
Lower, Mid, Upper |
|
Breakthrough low-demand |
SSP2-2.6 |
Trend |
✓ |
Rel. price increase |
Jet-A (fossil+SAF), LH2, Battery |
5.0 |
Lower, Mid, Upper |
Scenario-robust trend |
SSP2-1.9, 2.6, and 3.4 |
Trend |
Mean cumulative CO2 |
Jet-A (fossil+SAF), LH2, Battery |
5.0 |
Mid |
|
Scenario-robust low-demand |
SSP2-1.9, 2.6, and 3.4 |
Trend |
✓ |
Min rel. price increase |
Jet-A (fossil+SAF), LH2, Battery |
5.0 |
Mid |
We start with the baseline no-policy scenarios (SSP1, 2, and 5), where two new generations of conventional aircraft are launched, and their entry-into-service and deployment is optimized to minimize cumulative emissions, while consuming only fossil kerosene. The sensibility to maturing aircraft technology is also explored with 3 technology scenarios affecting: energy consumption of current aircraft, fleet replacement lifetimes, and energy consumption of new aircraft (Fig. 11).
Then the mitigation scenarios are explored using SSP2 as the baseline. The Drop-in trend mitigation scenarios also introduce incorporation of biofuel and electrofuel (SAF) in the Jet-A blend, and constraint the sectoral consumption of electricity and biomass to 5.0 % of the global supply. The Drop-in availability mitigation scenario increases the sectoral consumption to 8.6 %. And the Drop-in low-demand mitigation scenario keeps trend consumption, but avoids traffic in order to fulfill an additional constraint on the total cumulative emissions. As the baseline scenarios, these are also explored with 3 technology scenarios.
The Breakthrough mitigation scenario increments the Drop-in by introducing new alternative aircraft concepts (Battery-Electric, LH2 Fuel-Cell, and LH2 Gas Turbine), and is also divided into a trend, availability, and low-demand variant, each sweeping the 3 technology scenarios.
Finally, the scenario-robust mitigation scenarios keep all mitigation measures (SAF and deployment of alternative aircraft), but the objective is now to optimize the mean among 3 different background scenarios: SSP2-1.9, 2.6, and 3.4. These scenarios keep the trend assumption of 5.0 % global energy production allocated to aviation, and are divided into a trend and low-demand variant. For simplification purposes, these are only explored with the Mid aircraft technology.
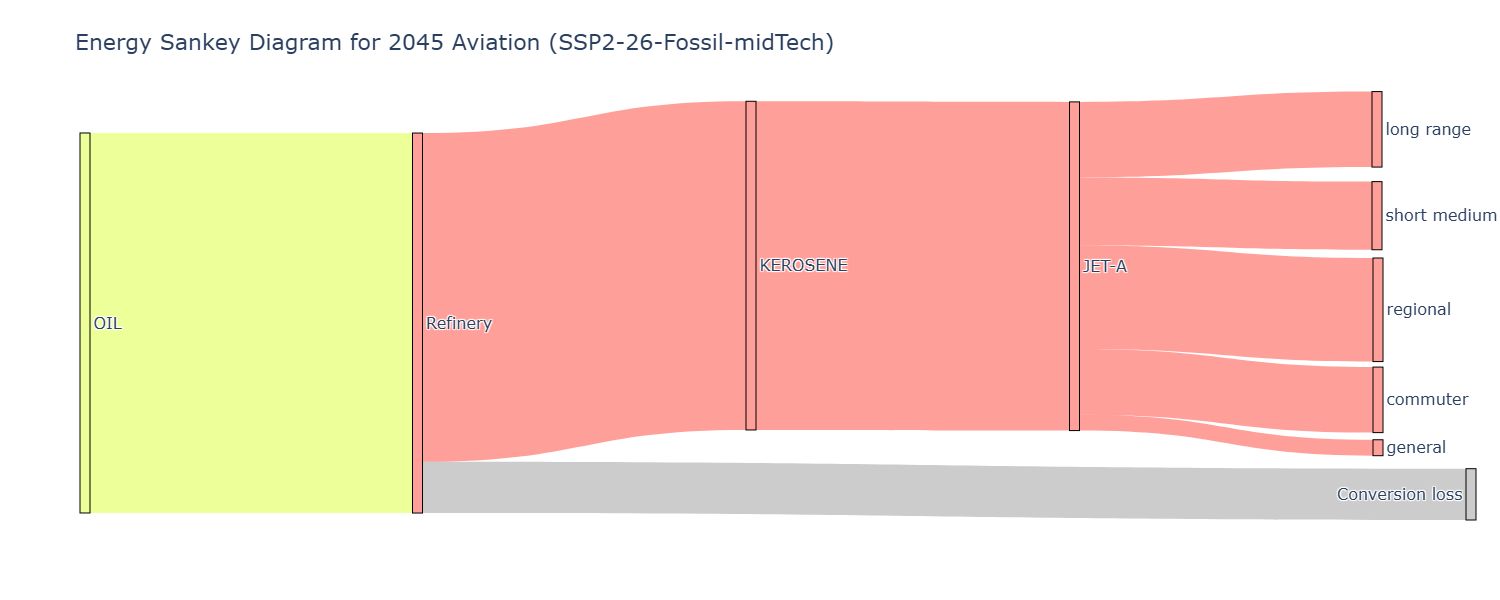
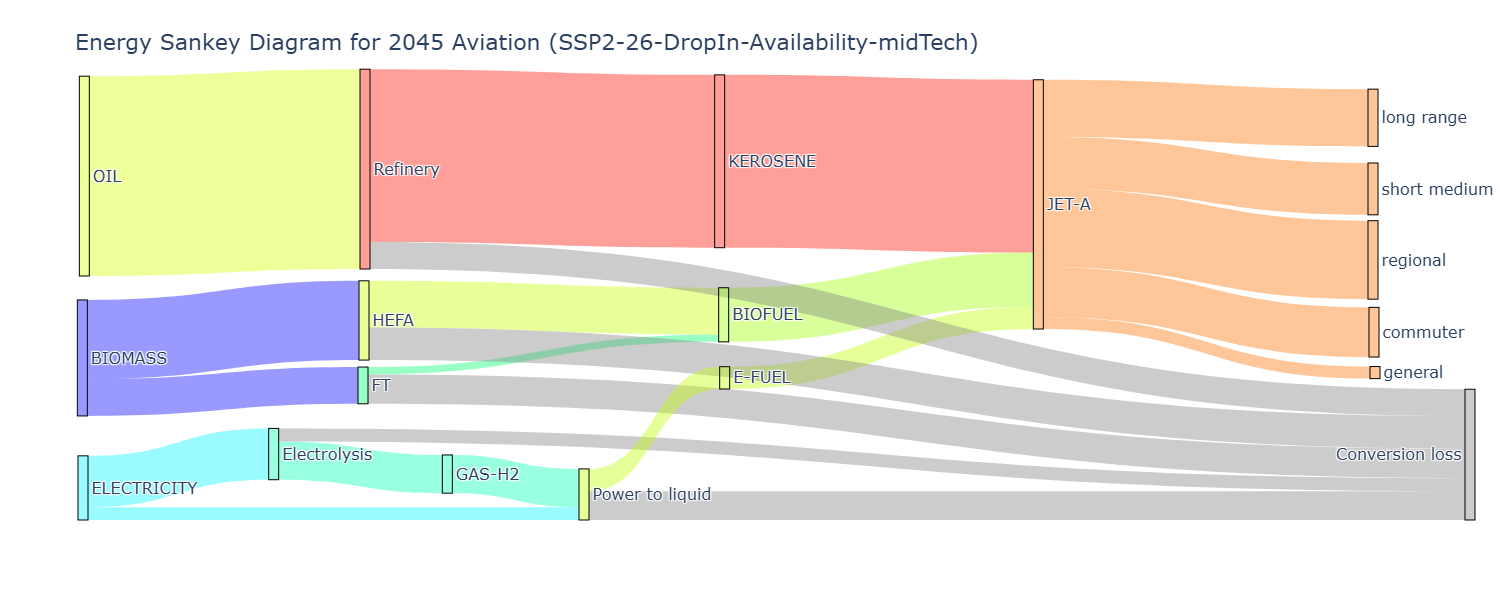
Energy production sankey diagrams. Comparison of energy production sankey diagram for global aviation by 2045 for SSP2 scenarios: (a) Baseline, (b) Drop-in, and (c) Breakthrough. These also assume extra energy availability, and Mid aircraft technology.
(a) Baseline:
(b) Drop-in:
(c) Breakthrough:
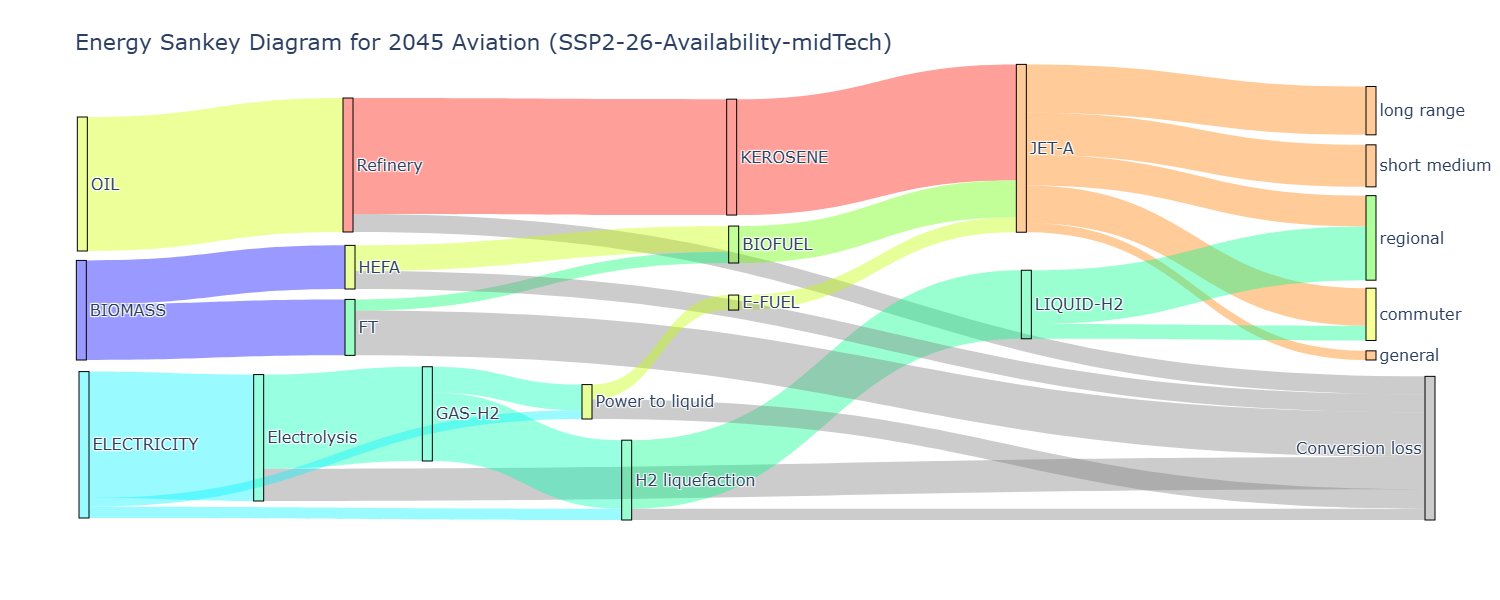

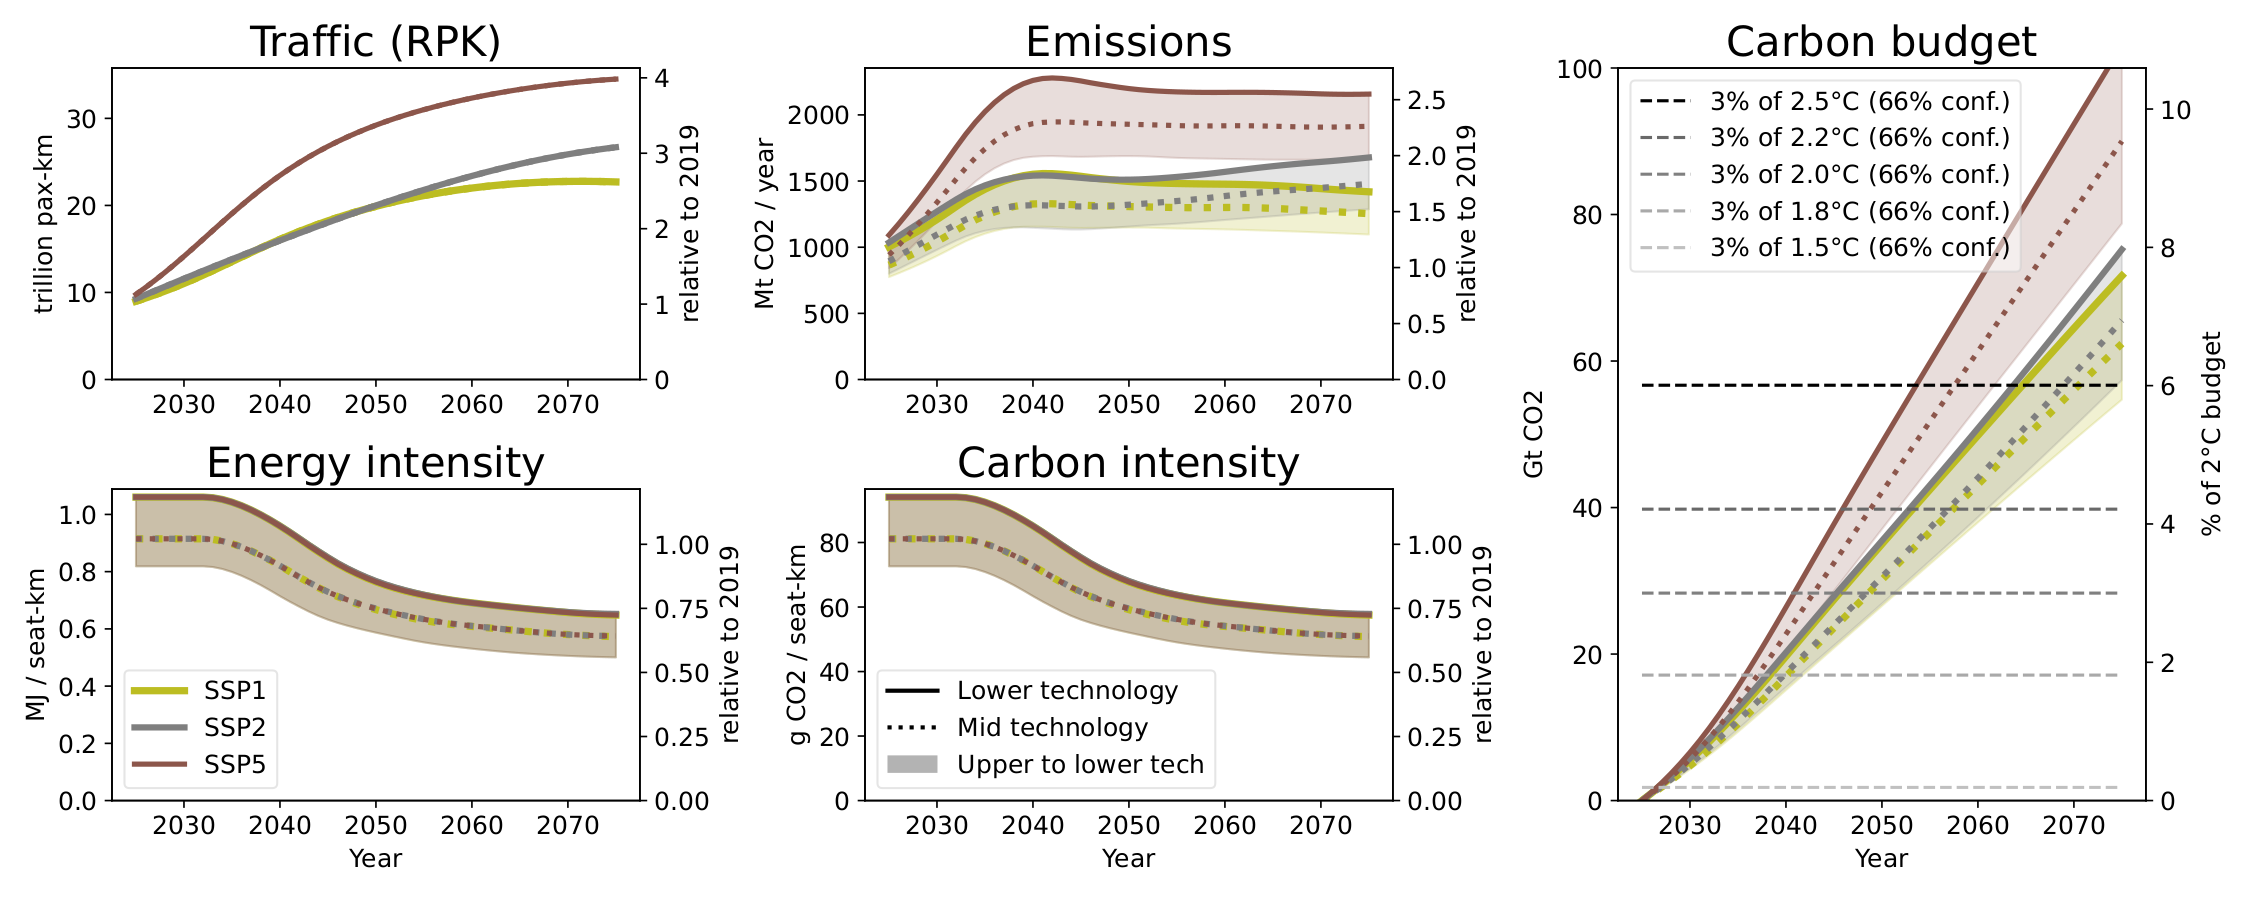
Fig. 17 Comparison of scenario trends (traffic, annual and cumulative emissions, carbon and energy intensity) for the Baseline scenarios. The sensibility to aircraft technology is displayed with 3 aircraft technology scenarios: Lower (continuous line), Mid (dotted line), and Upper technology (shadowed region).#
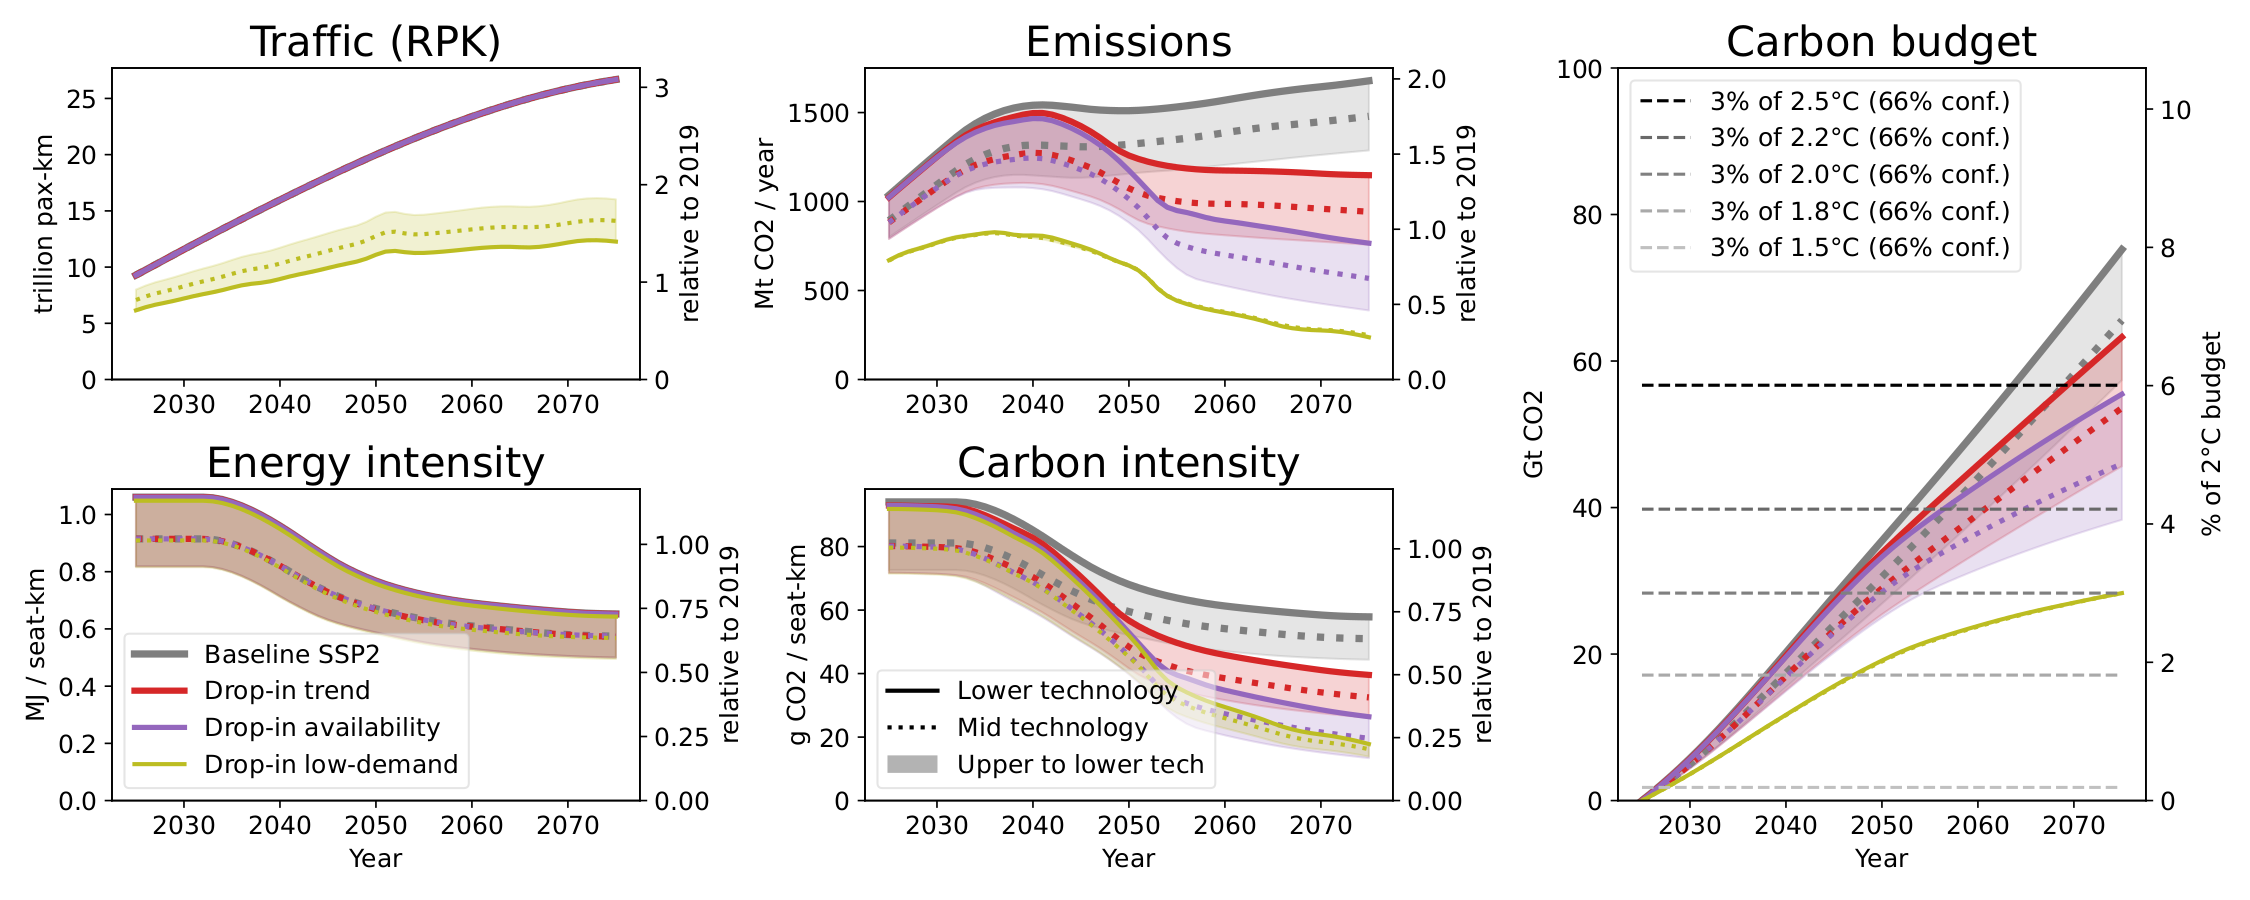
Fig. 18 Comparison of scenario trends for the Drop-in scenarios (legend as in Fig. 17).#
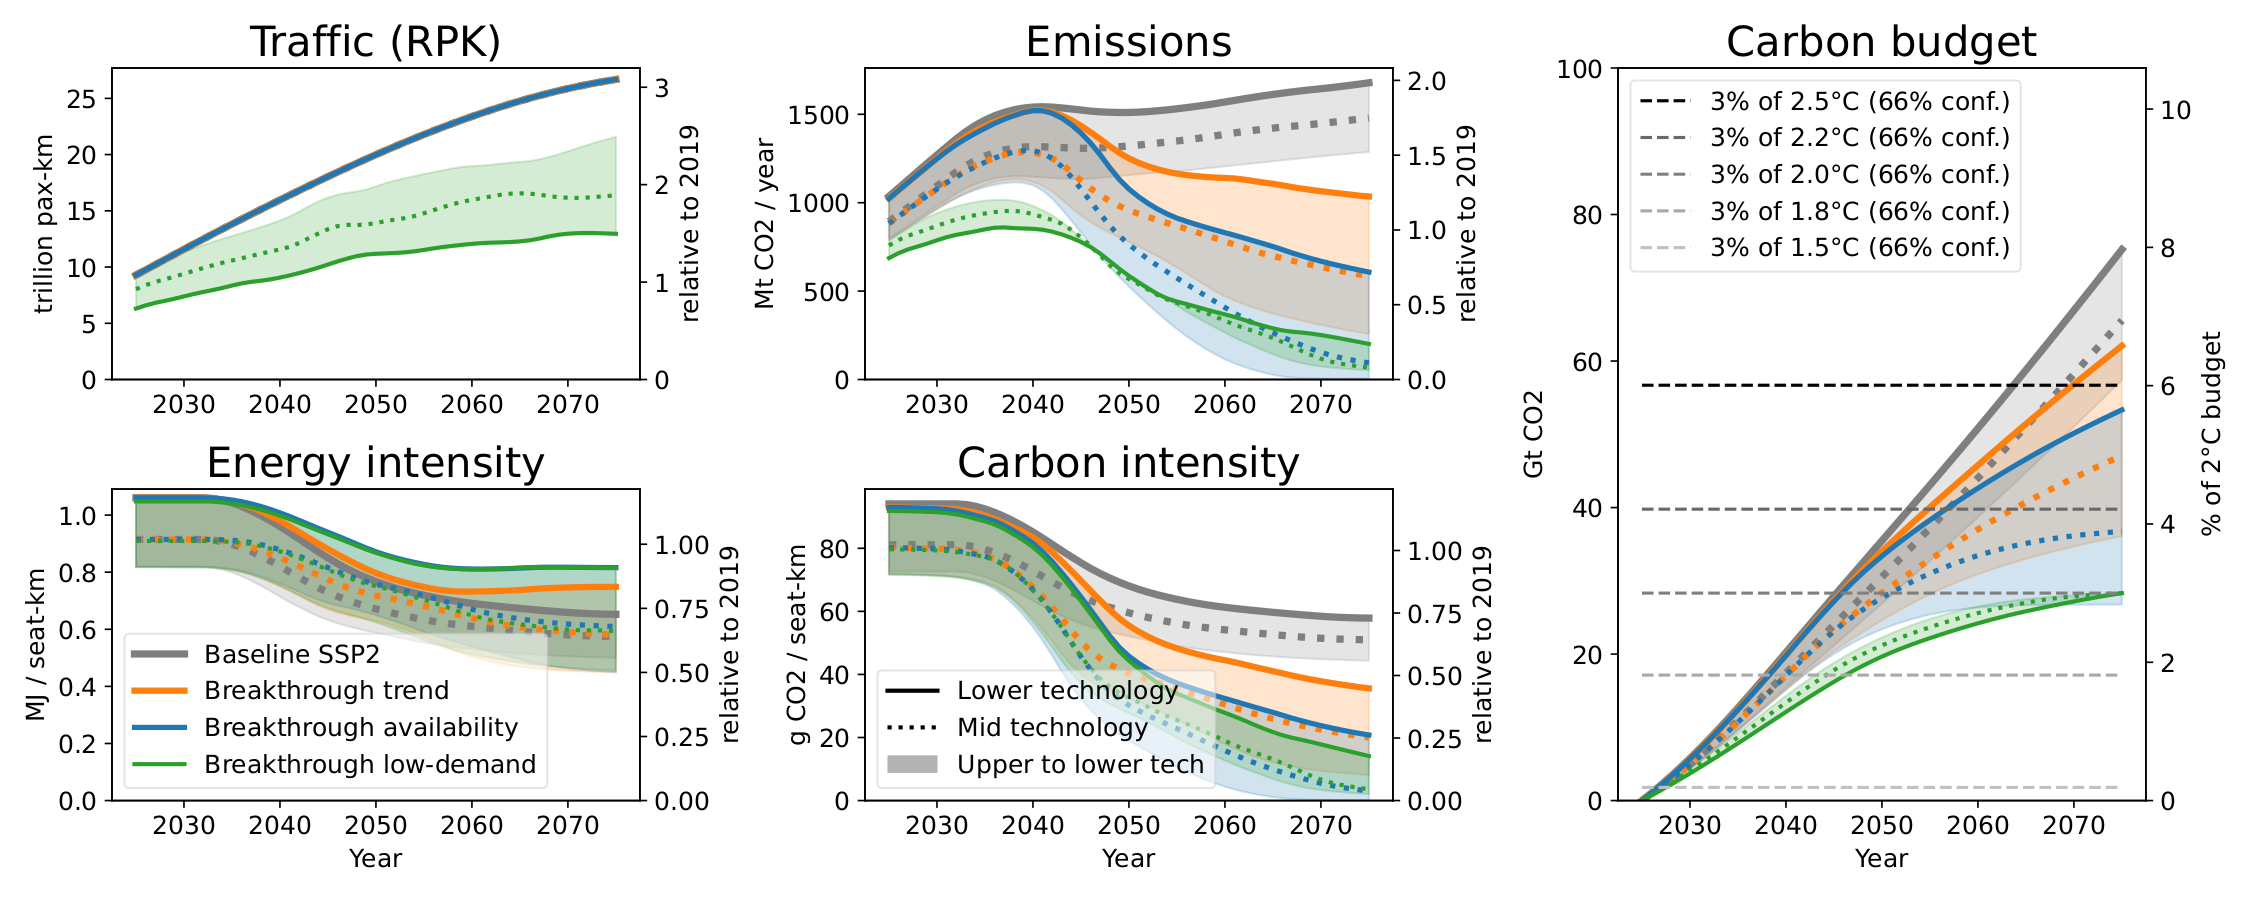
Fig. 19 Comparison of scenario trends for the Breakthrough scenarios (legend as in Fig. 17).#
The overall scenario results are presented and analyzed here; the full fleet and energy results are presented at the end of each scenario section.