
Mitigation policy optimization#
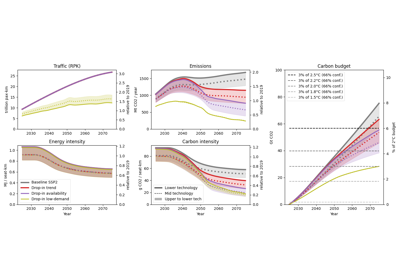
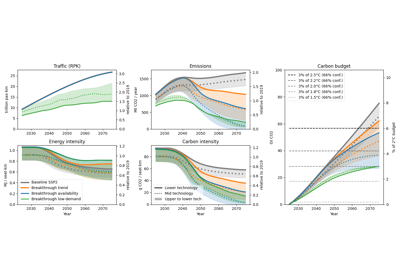
The outcomes of Drop-in and Breakthrough mitigation are presented in Fig. 18 and Fig. 19 and compared with the no-policy baseline SSP2.
Overall, the Drop-in mitigation scenarios are less sensitive to aircraft technology assumptions, as emission reductions is achieved either with SAF incorporation or demand aversion. The trend variant reaches emission levels comparable to 2019, but fails to phase out of consuming fossil fuels. The availability variant further reduces emission levels, and allow for much lower fossil consumption. The low-demand variant, traffic is nearly half of the trend by 2070, but still around 50 % higher than the 2019 reference, this variant is the only one that allows for keeping the cumulative emissions in check with the Paris Agreement, phasing out of fossil consumption, and lowering the emissions peak.
The Breakthrough mitigation displays much higher sensitivity to aircraft technology, lower emission levels than Drop-in mitigation (when compared with similar technology), and lower fossil consumption. The trend variant, for instance, still consumes fossil fuels and can emit more than 2019 emissions with Lower technology, or less than half of 2019 with Upper technology. The availability variant can reach near zero emissions after 2070, phasing out of fossil can happen as soon as 2060, allowing for relaxing the biomass consumption constraint, but cumulative emissions are still higher than the sector’s fair share. The low-demand variant respects the carbon budget constraint with much less difficulty than the Drop-in low-demand, allowing for much higher demand levels, which may reach up to 140 % more traffic than 2019, but is still lower than the trend 200 % increase.
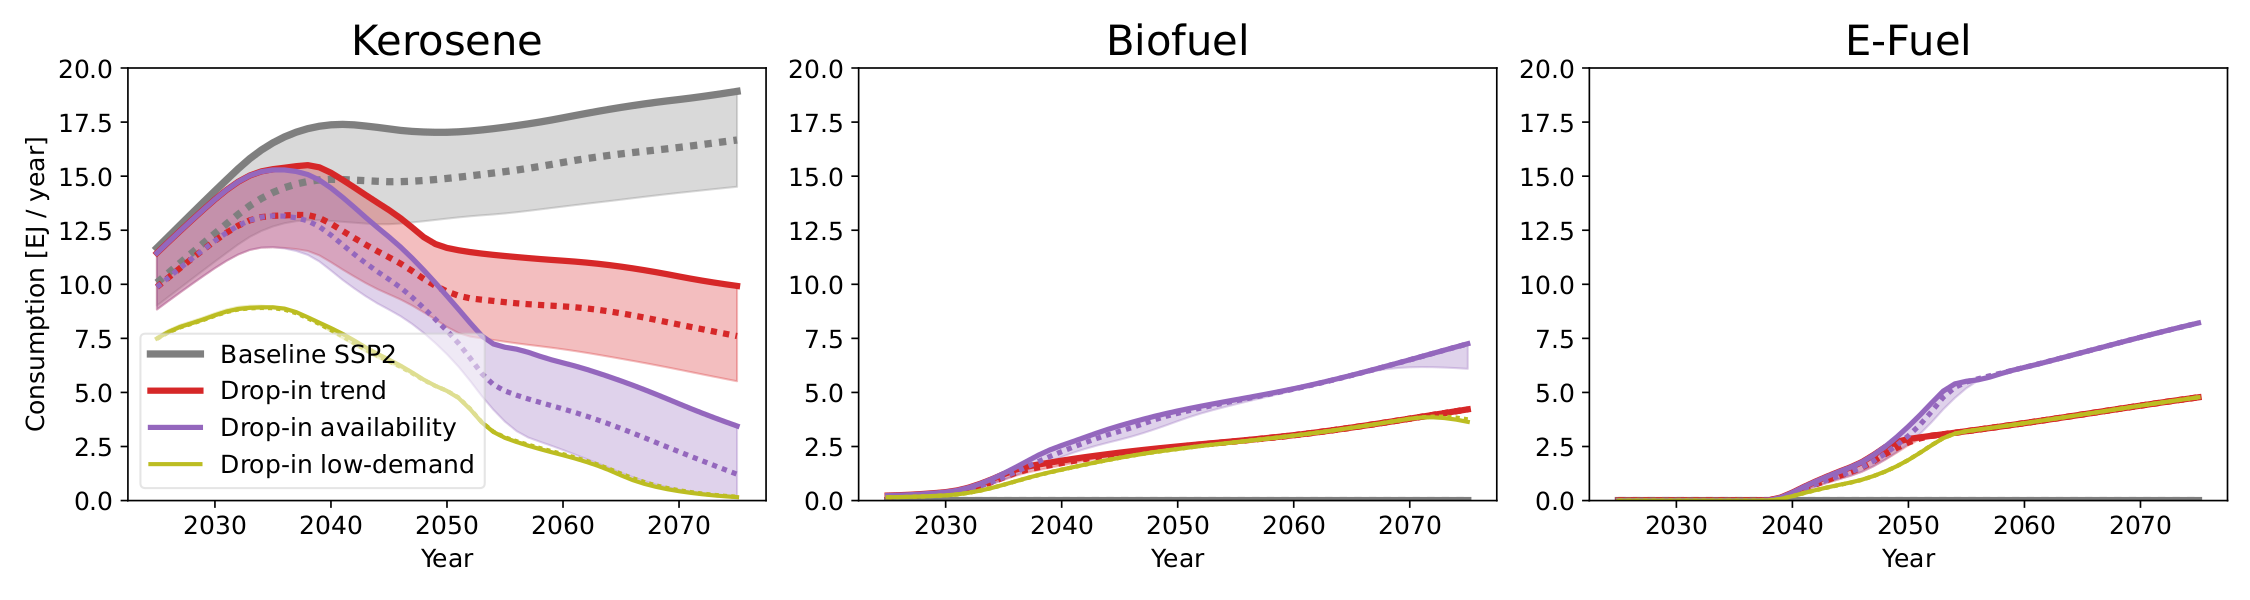
Fig. 21 Comparison of Jet-A fuel blend for the Drop-in scenarios. The sensibility to aircraft technology is displayed with 3 scenarios of component-level performances: Lower technology (continuous line), Mid technology (dotted line), and Upper technology (shadowed region). These impact the performance of current and new aircraft designs, as well as the speed of fleet renewal.#
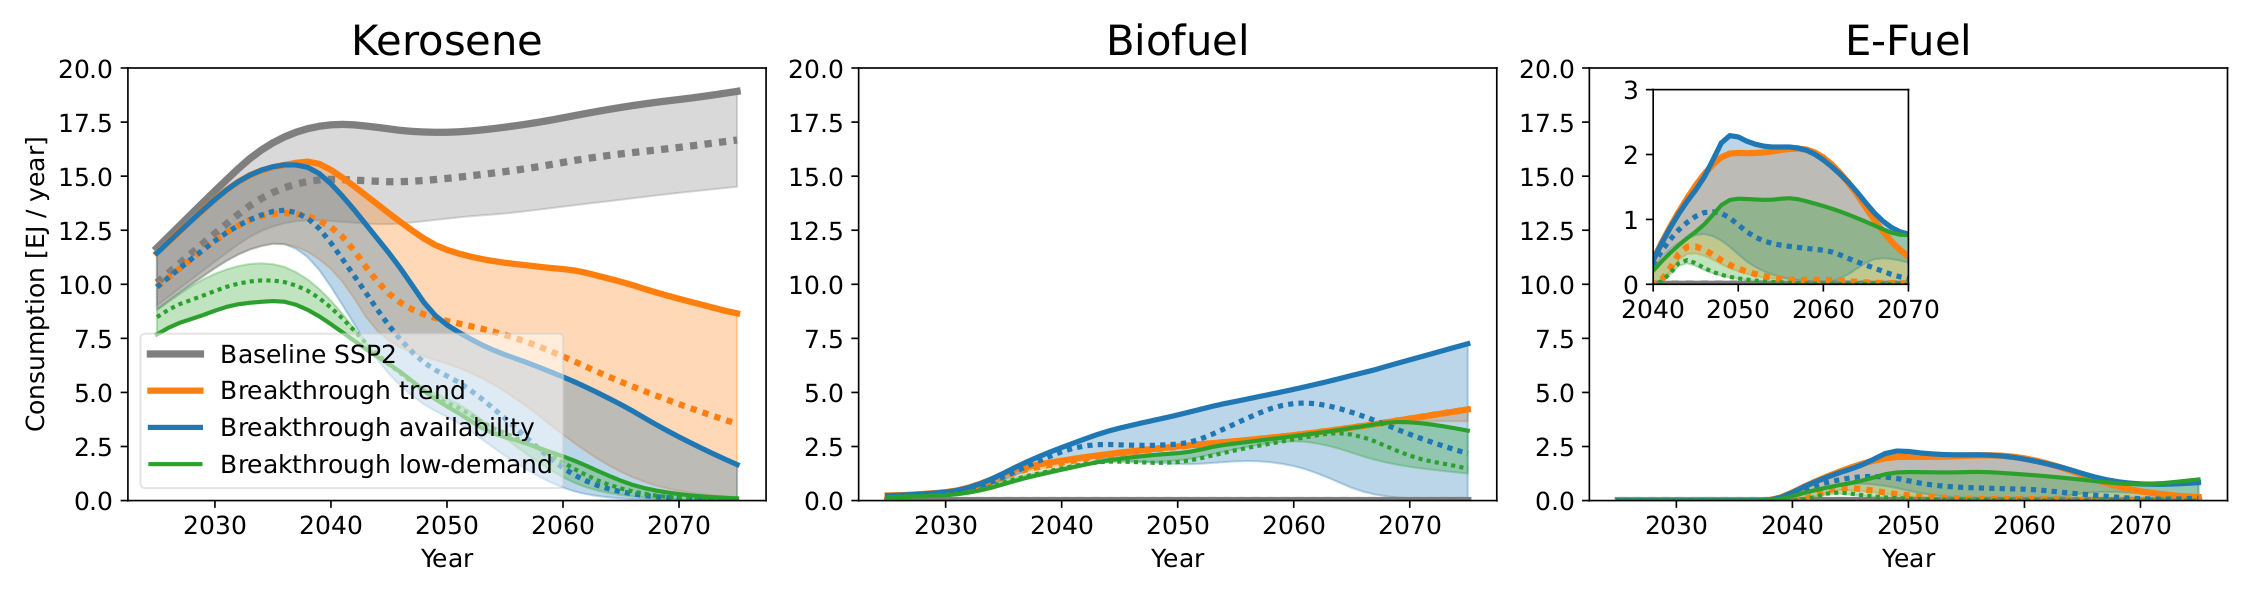
Fig. 22 Comparison of Jet-A fuel blend for the Breakthrough scenarios (legend as in Fig. 21).#
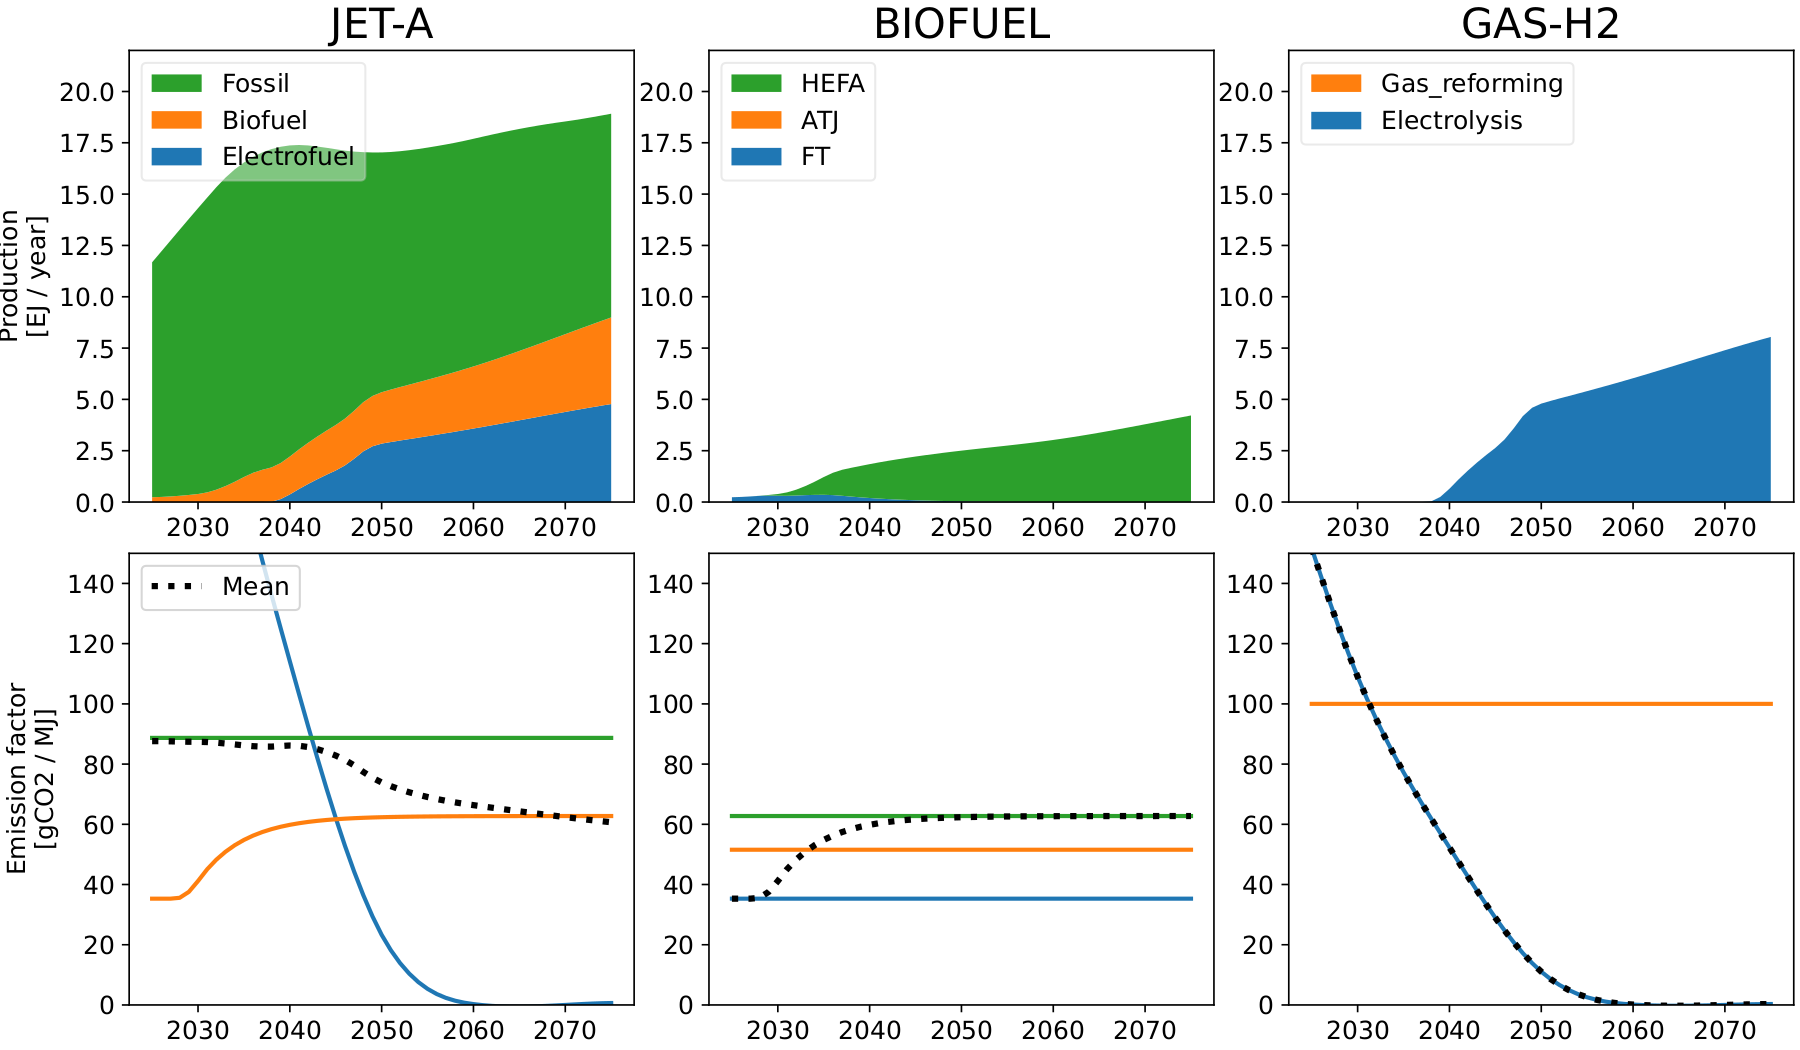
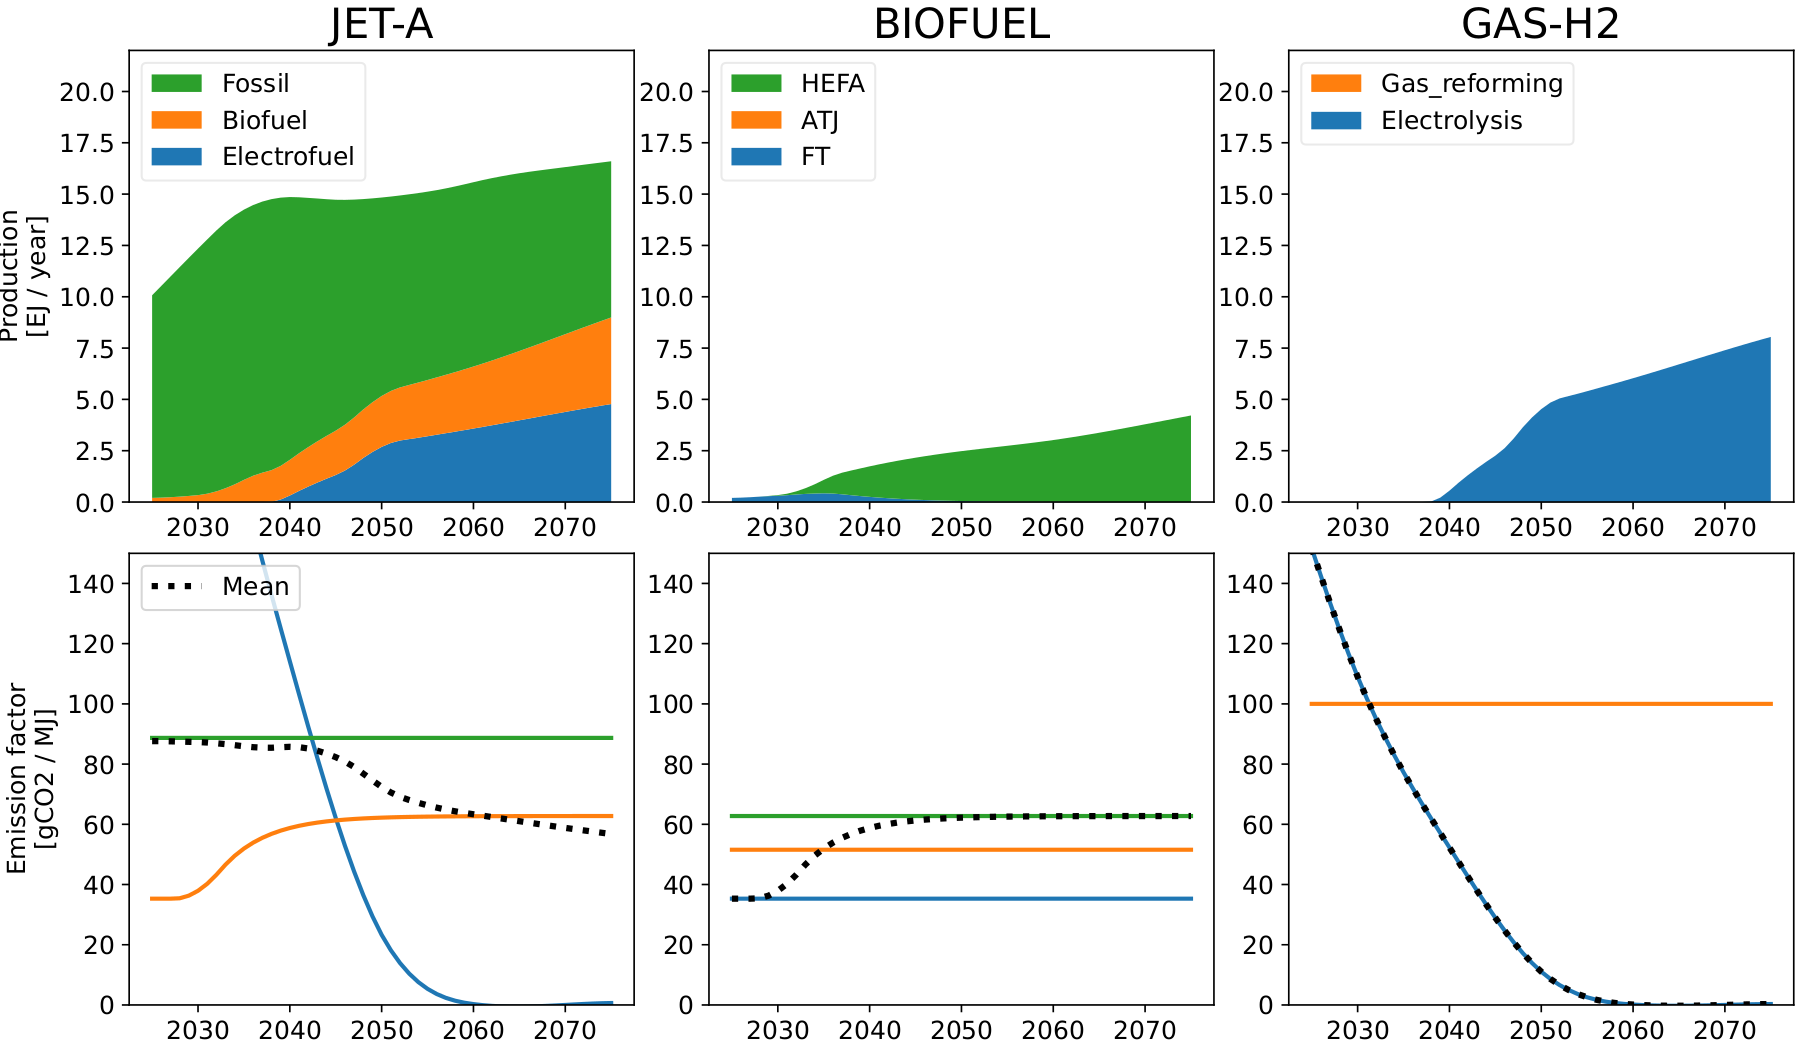
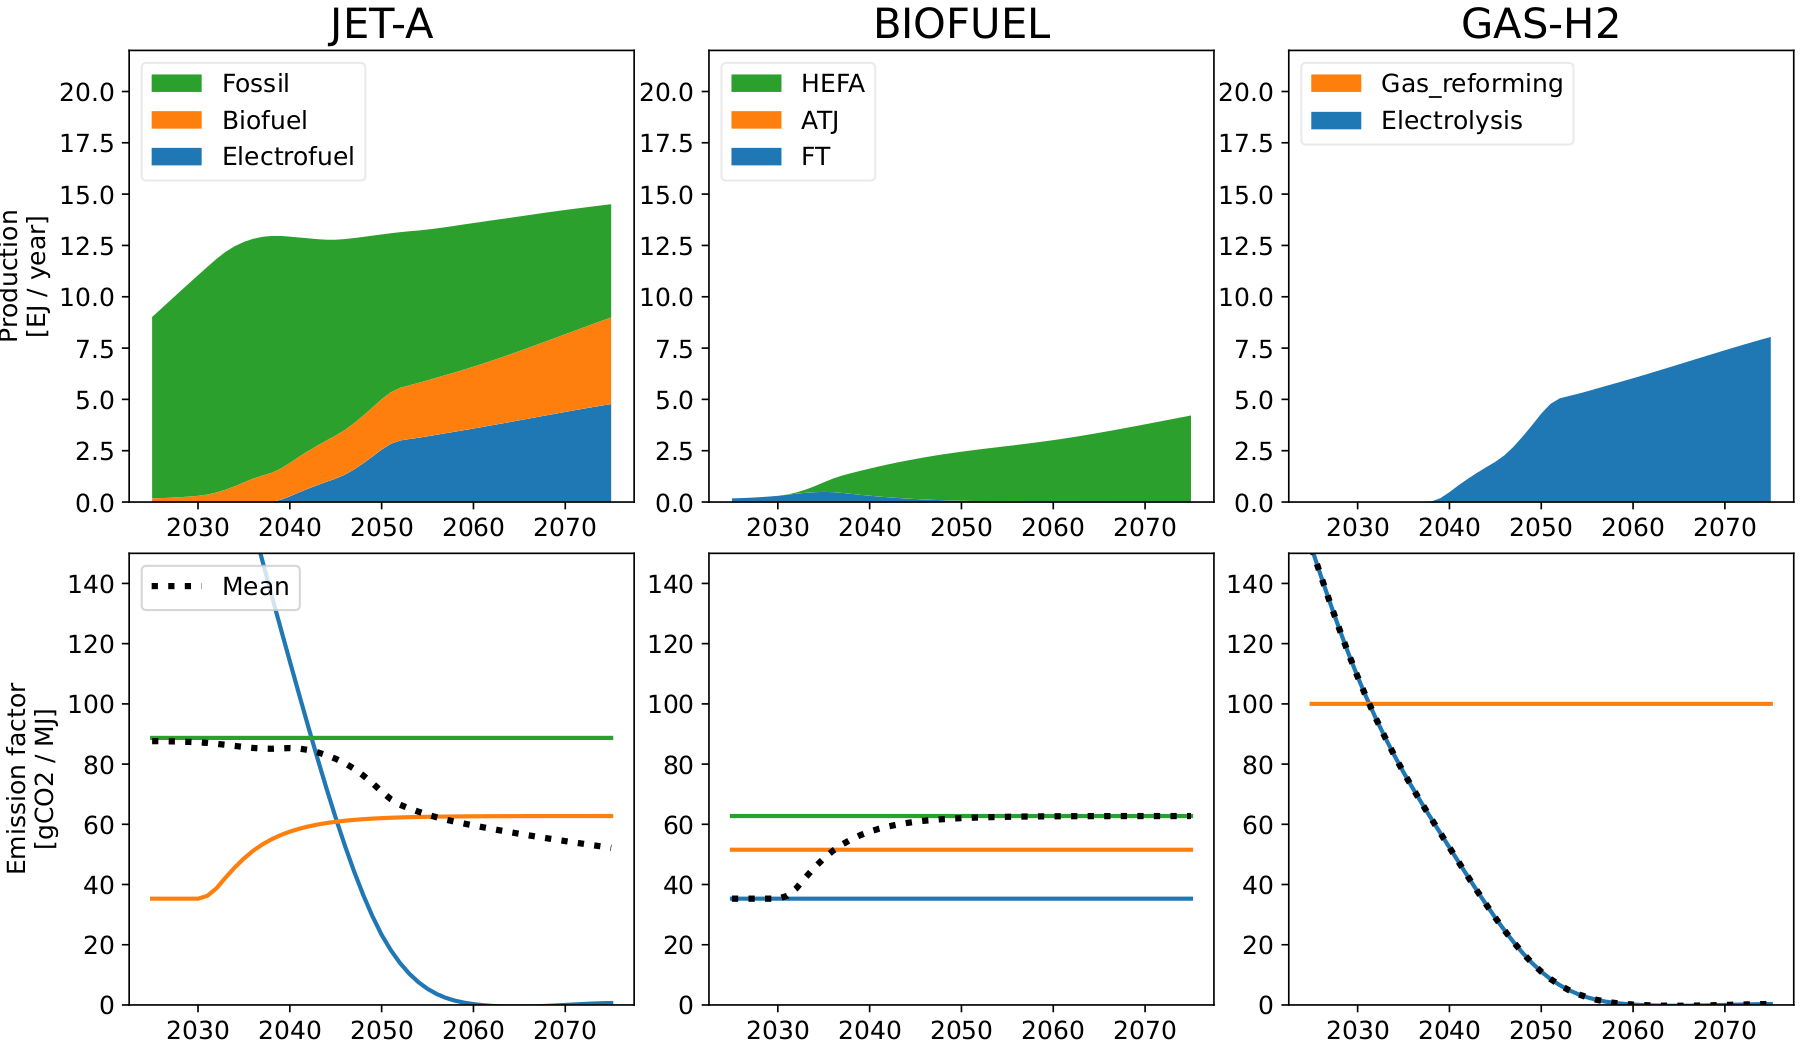
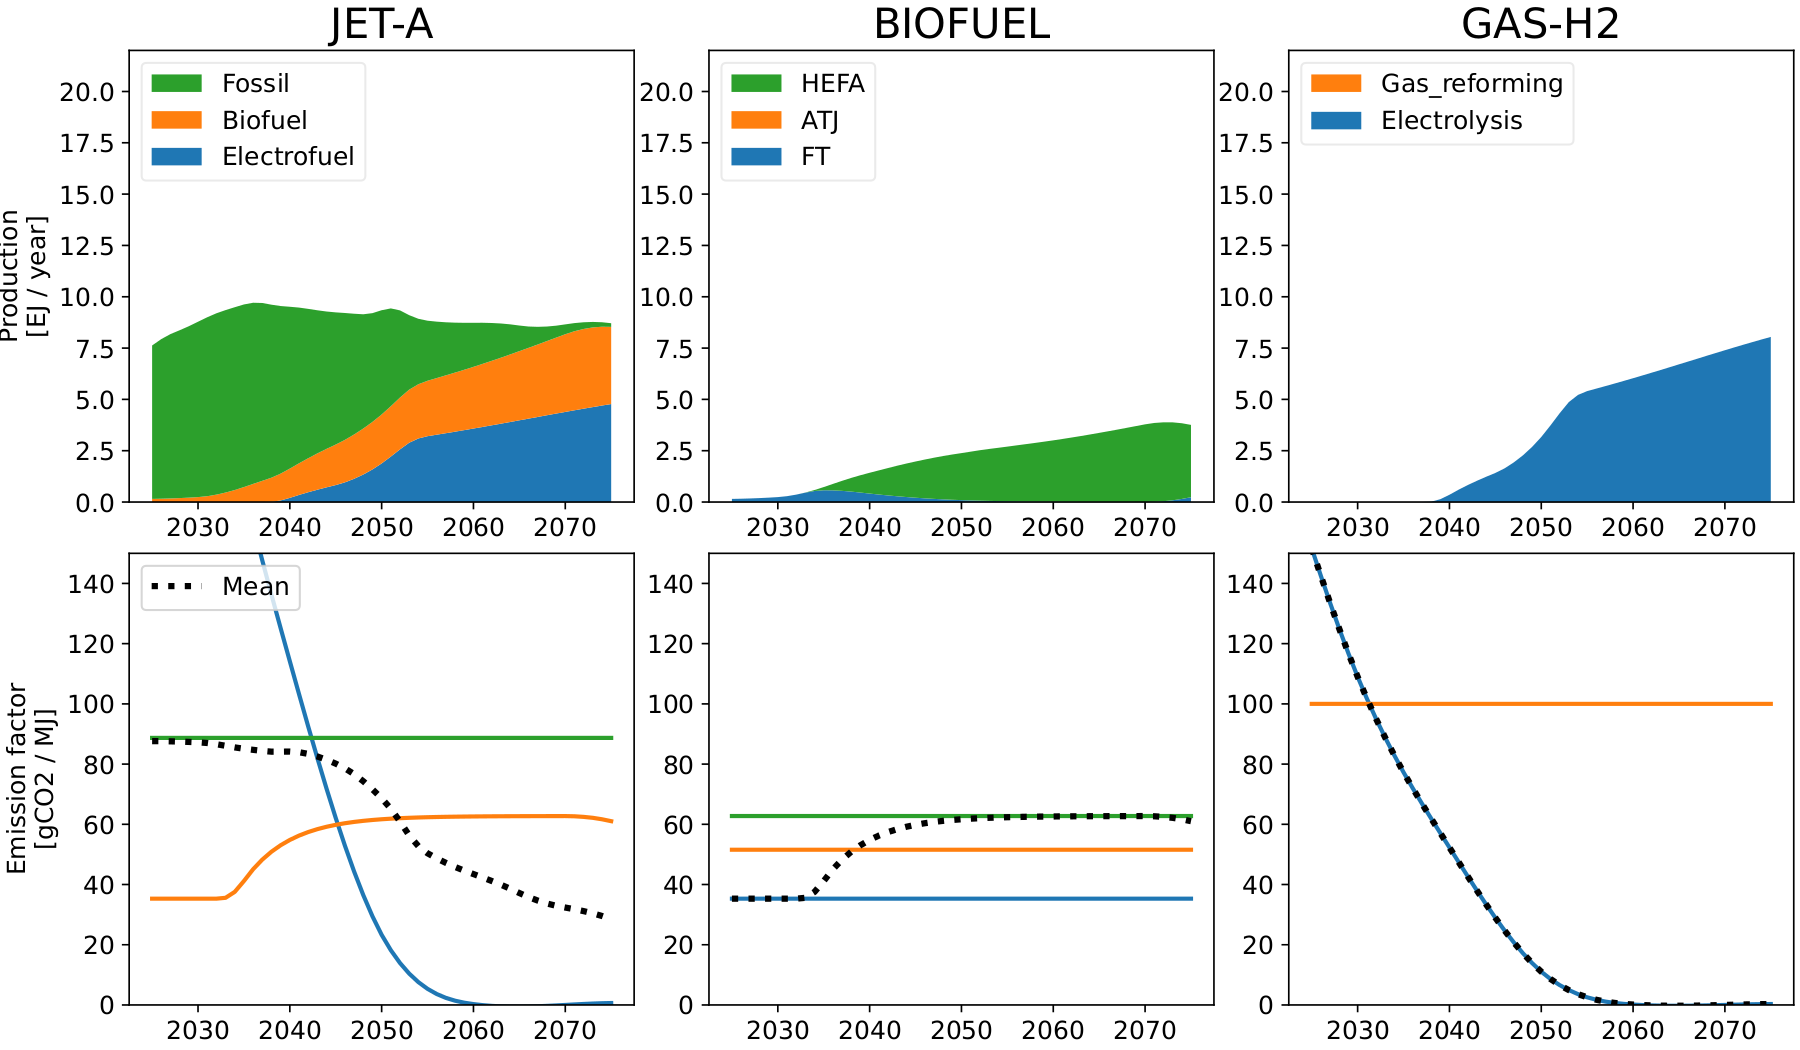
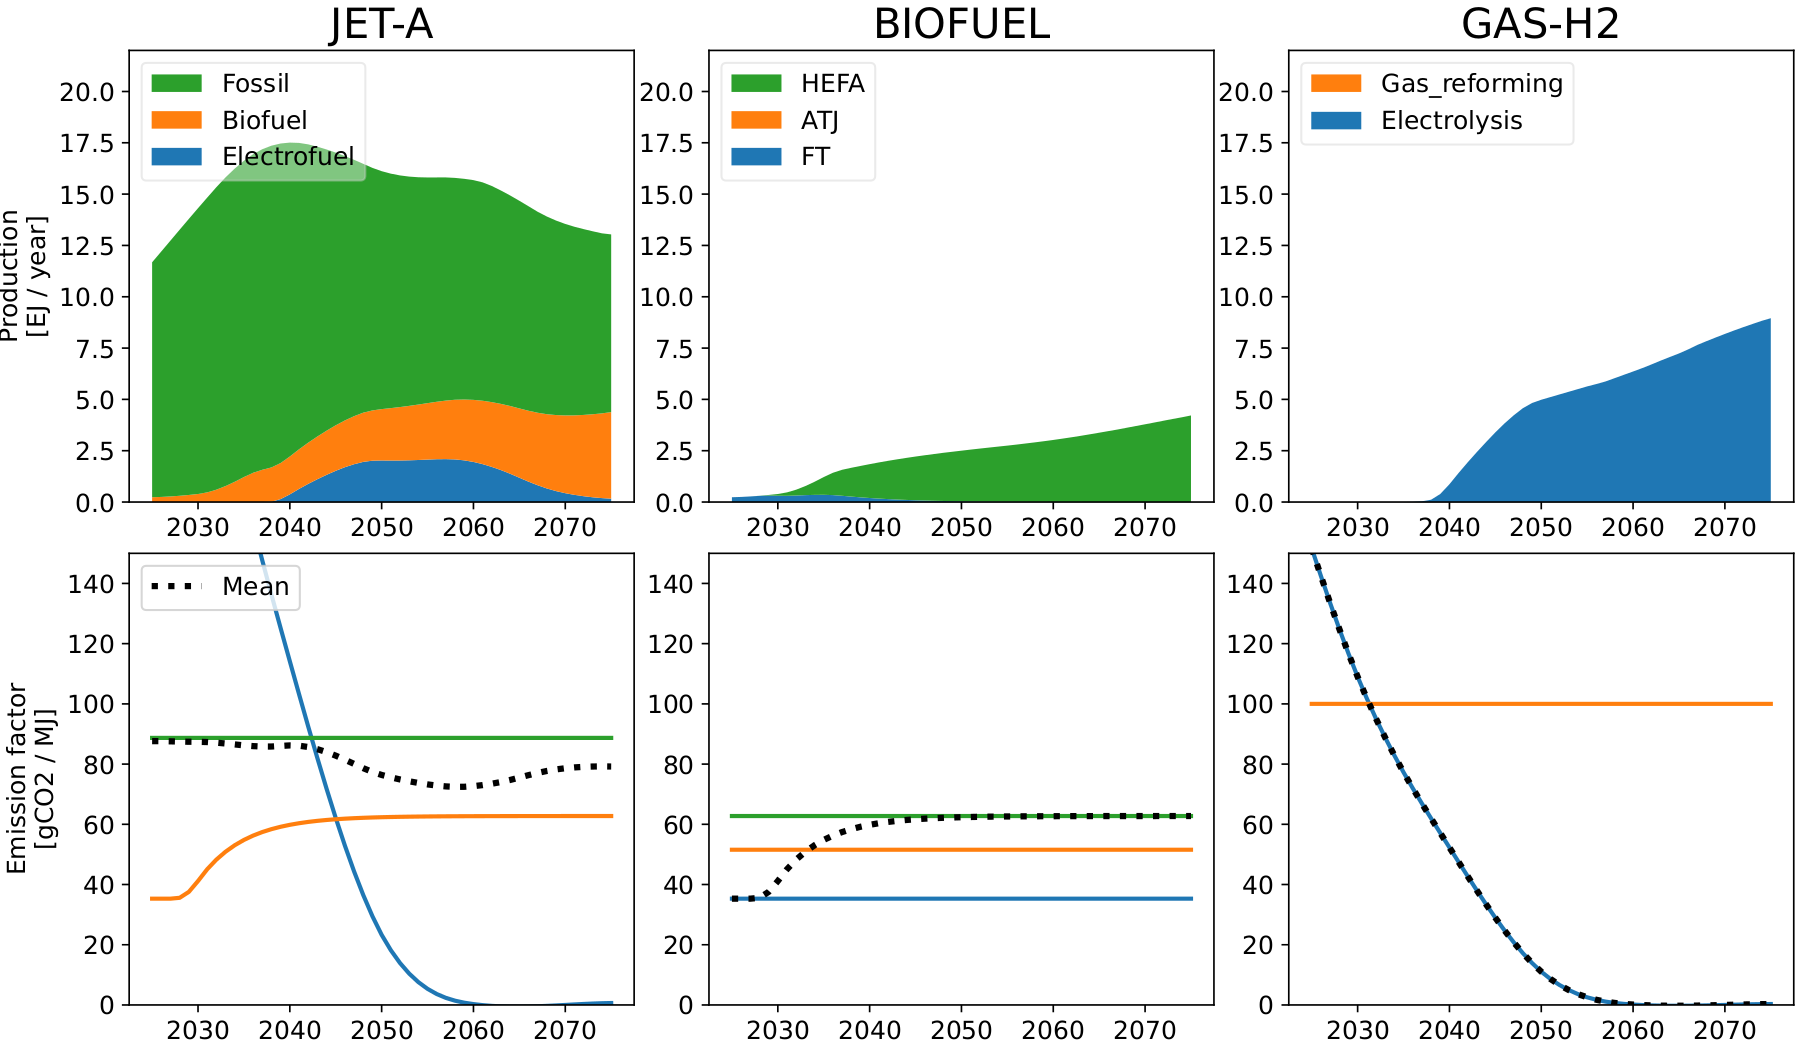
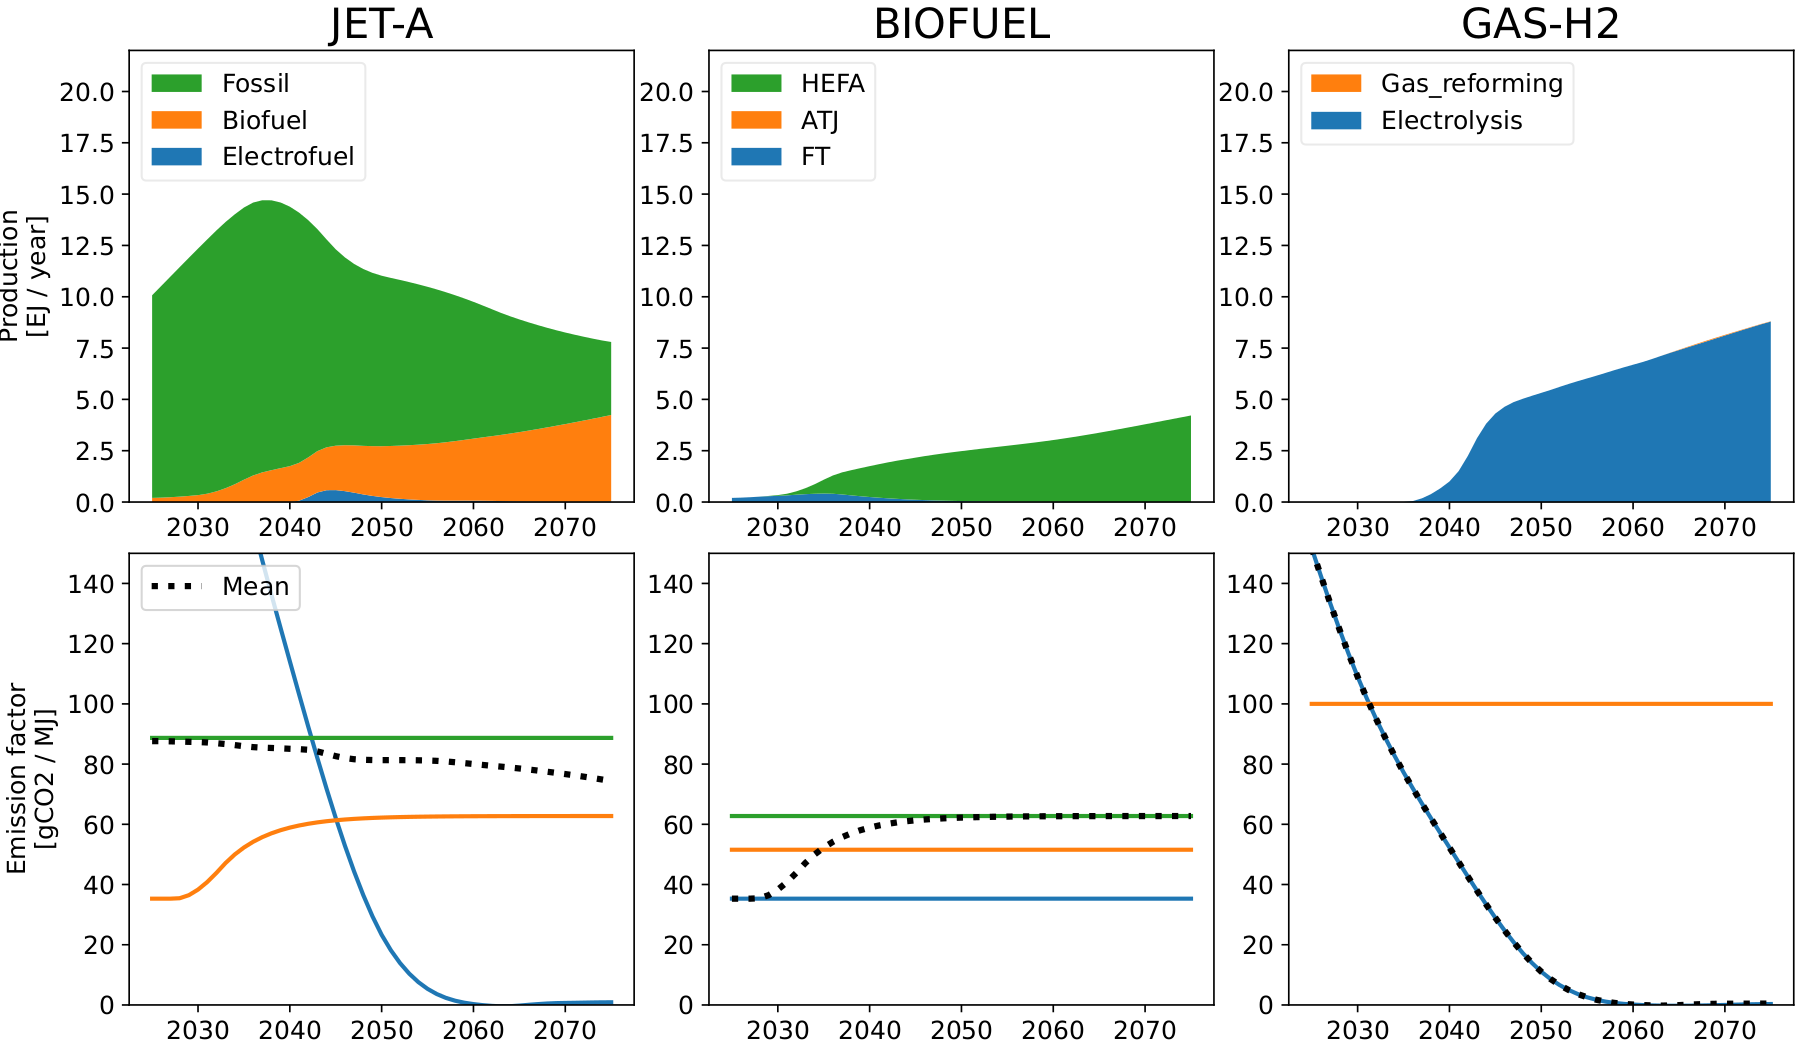
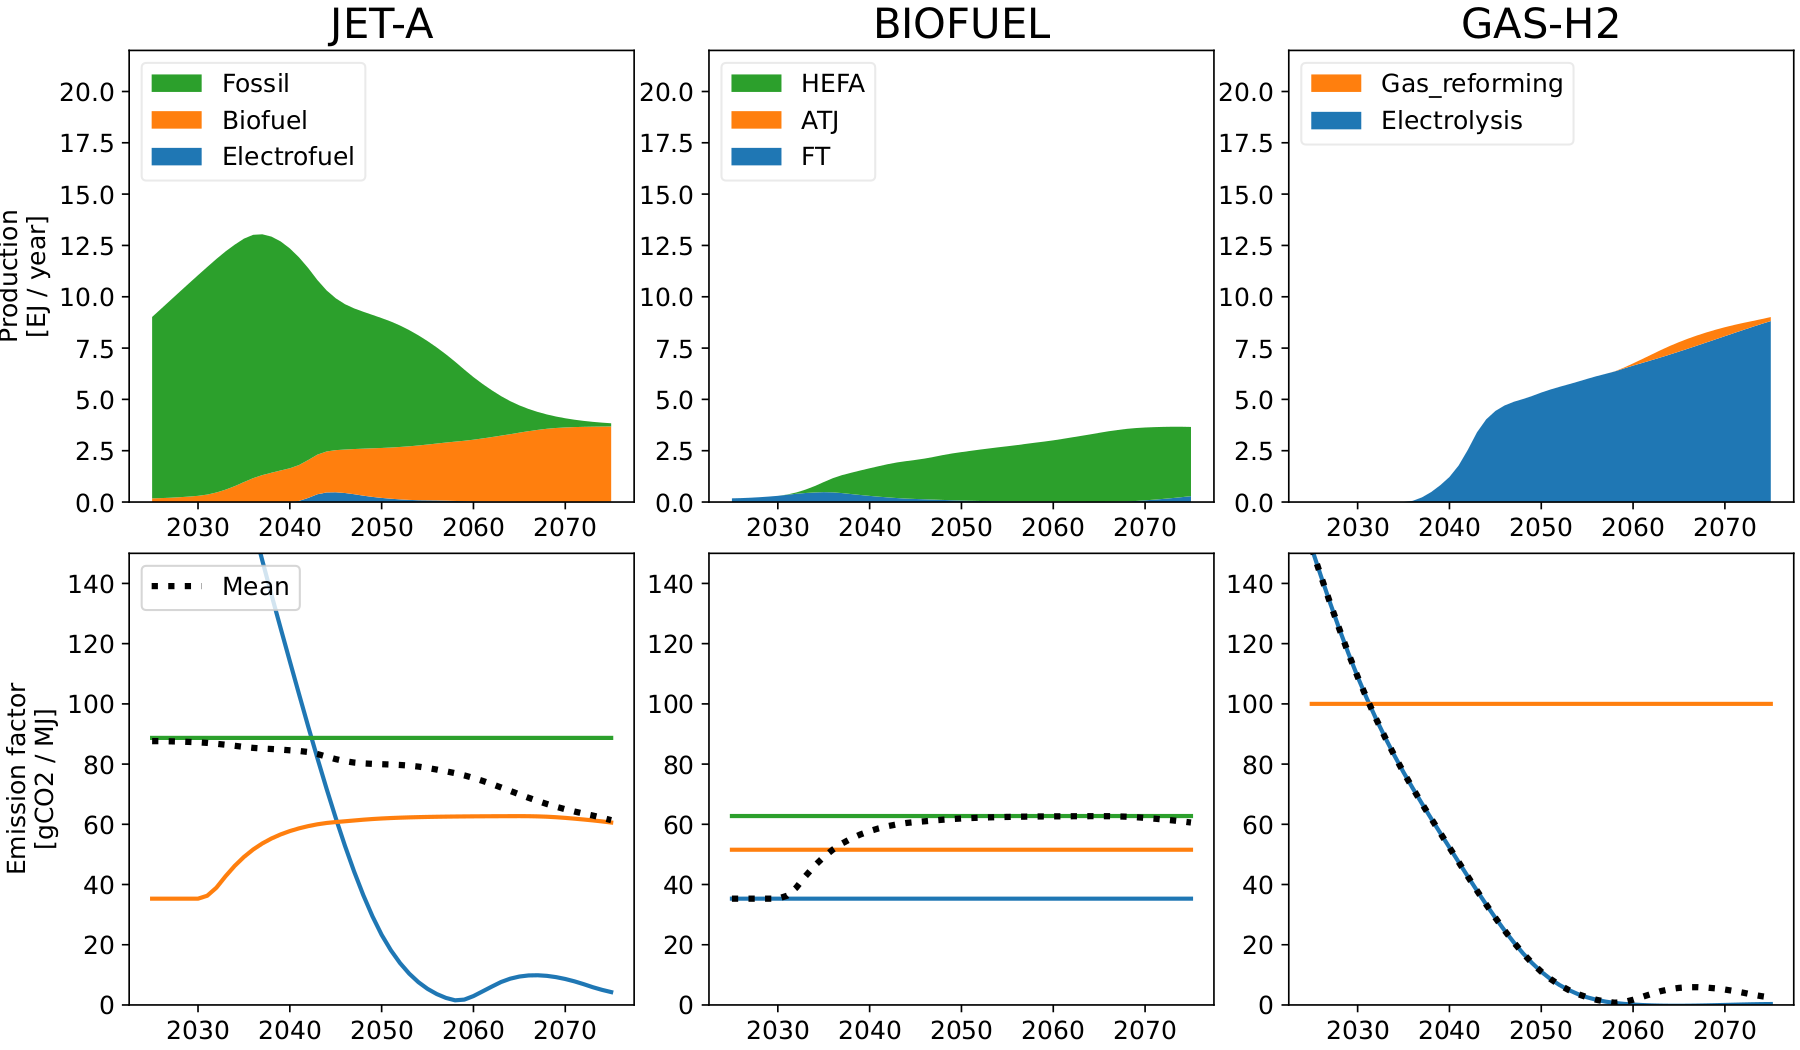
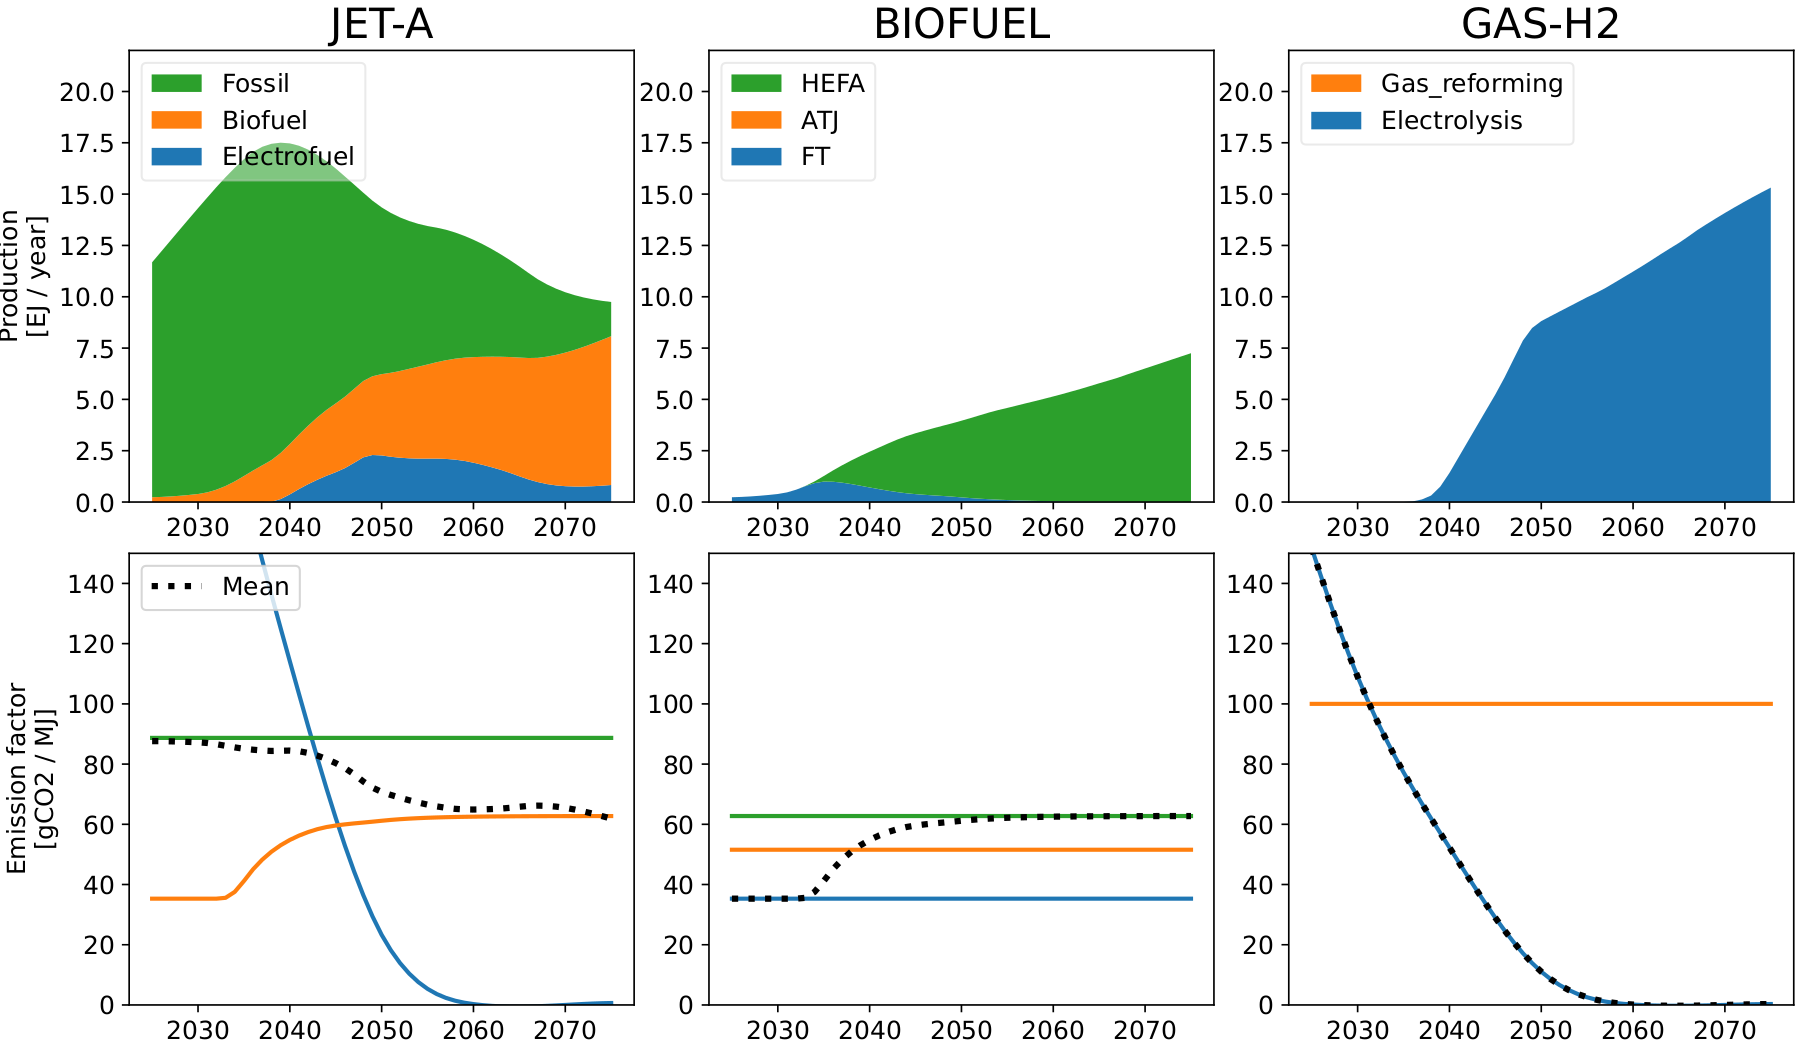
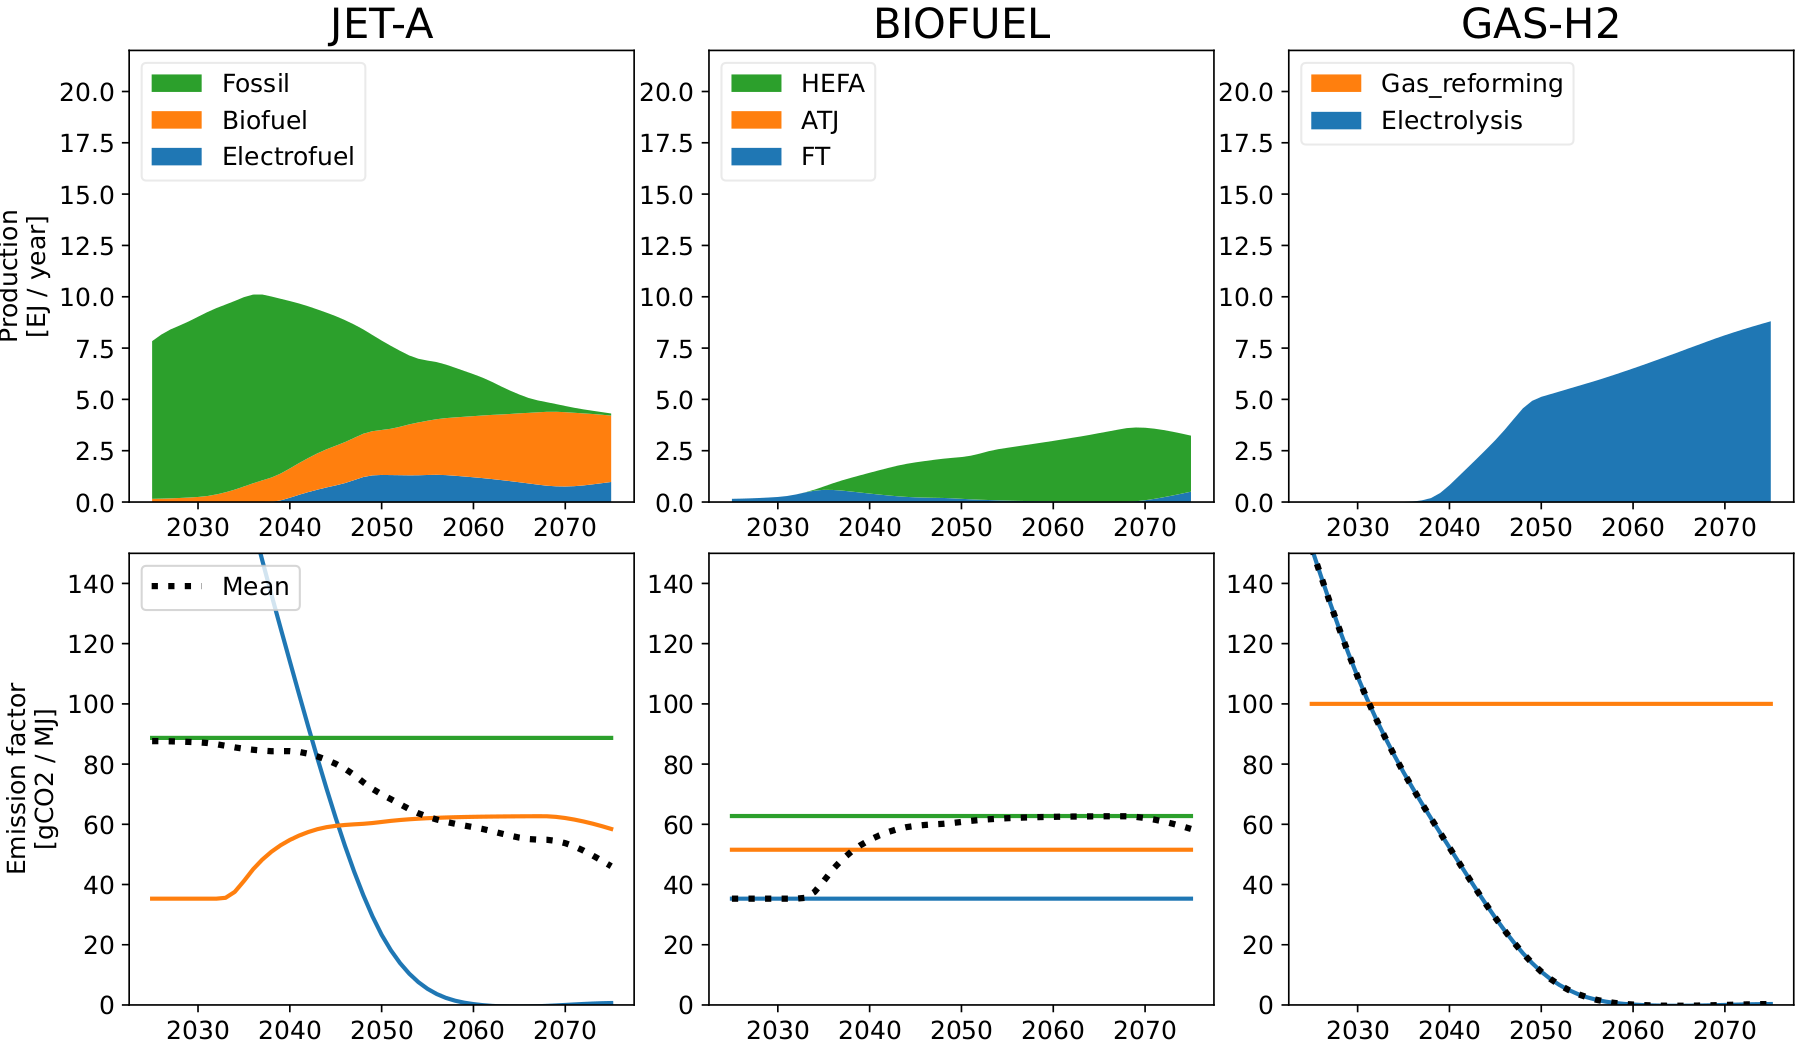
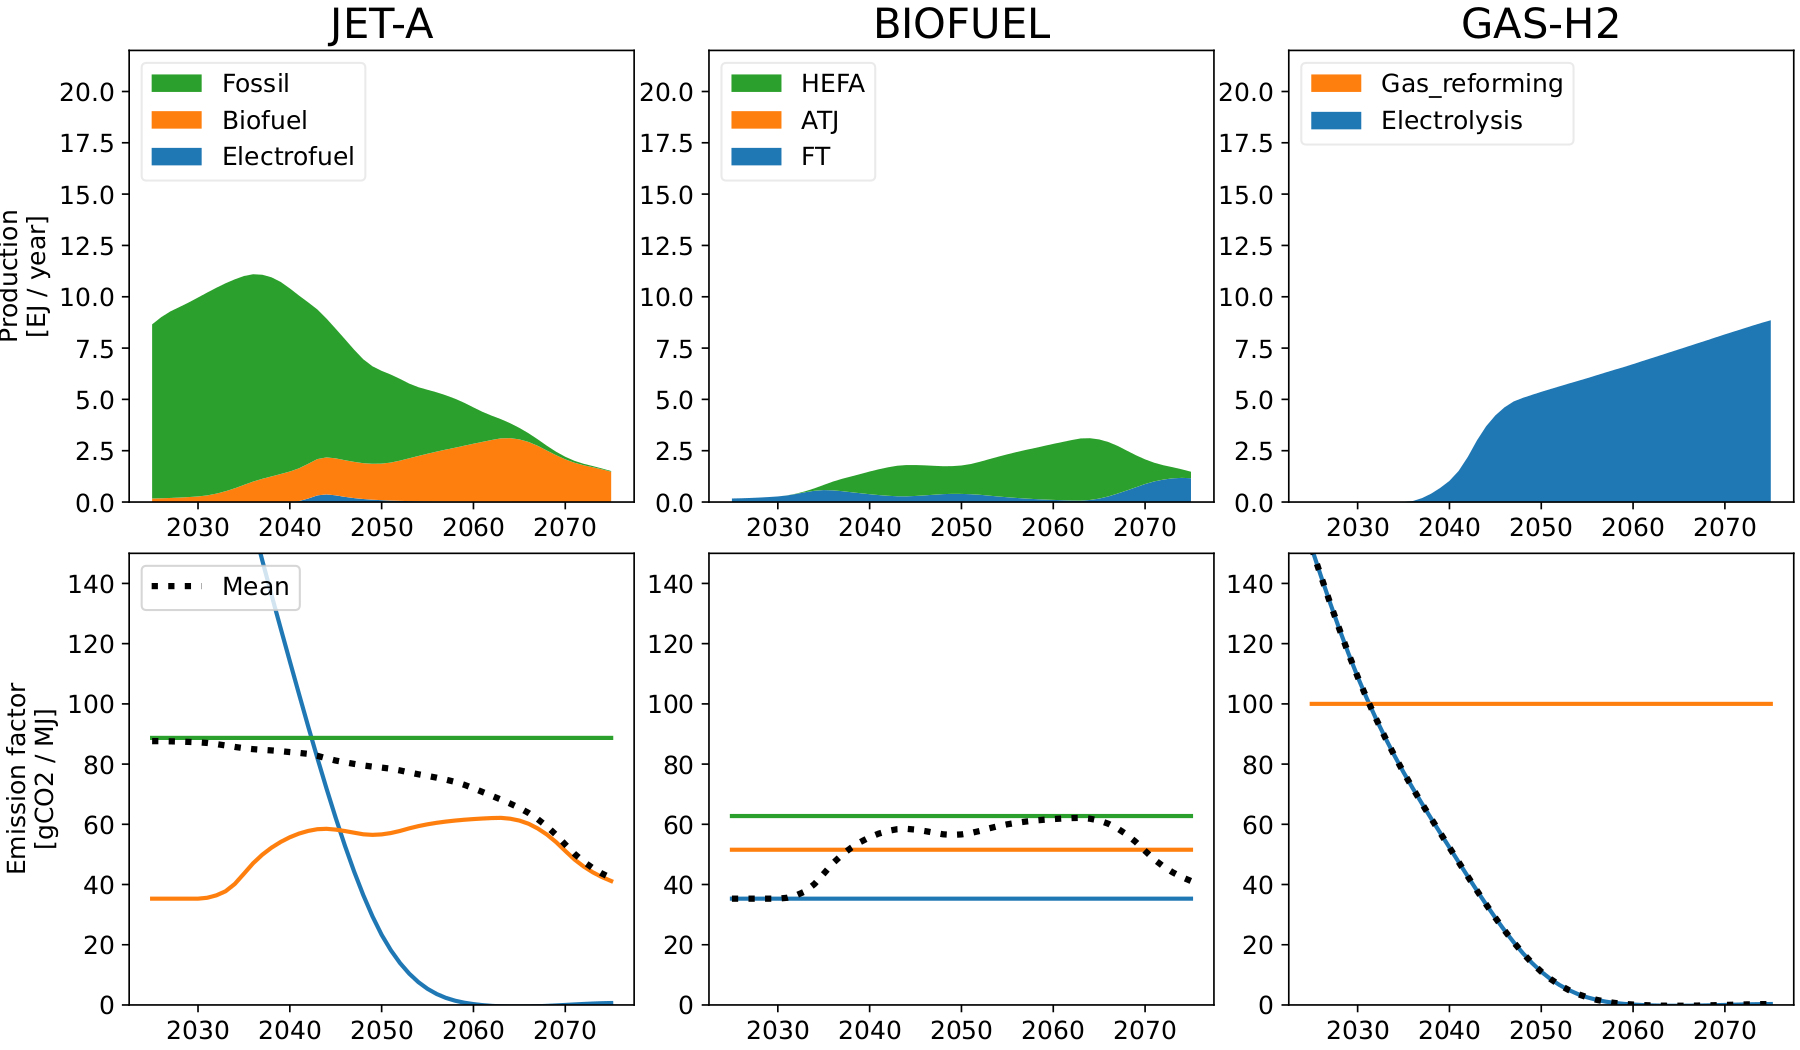
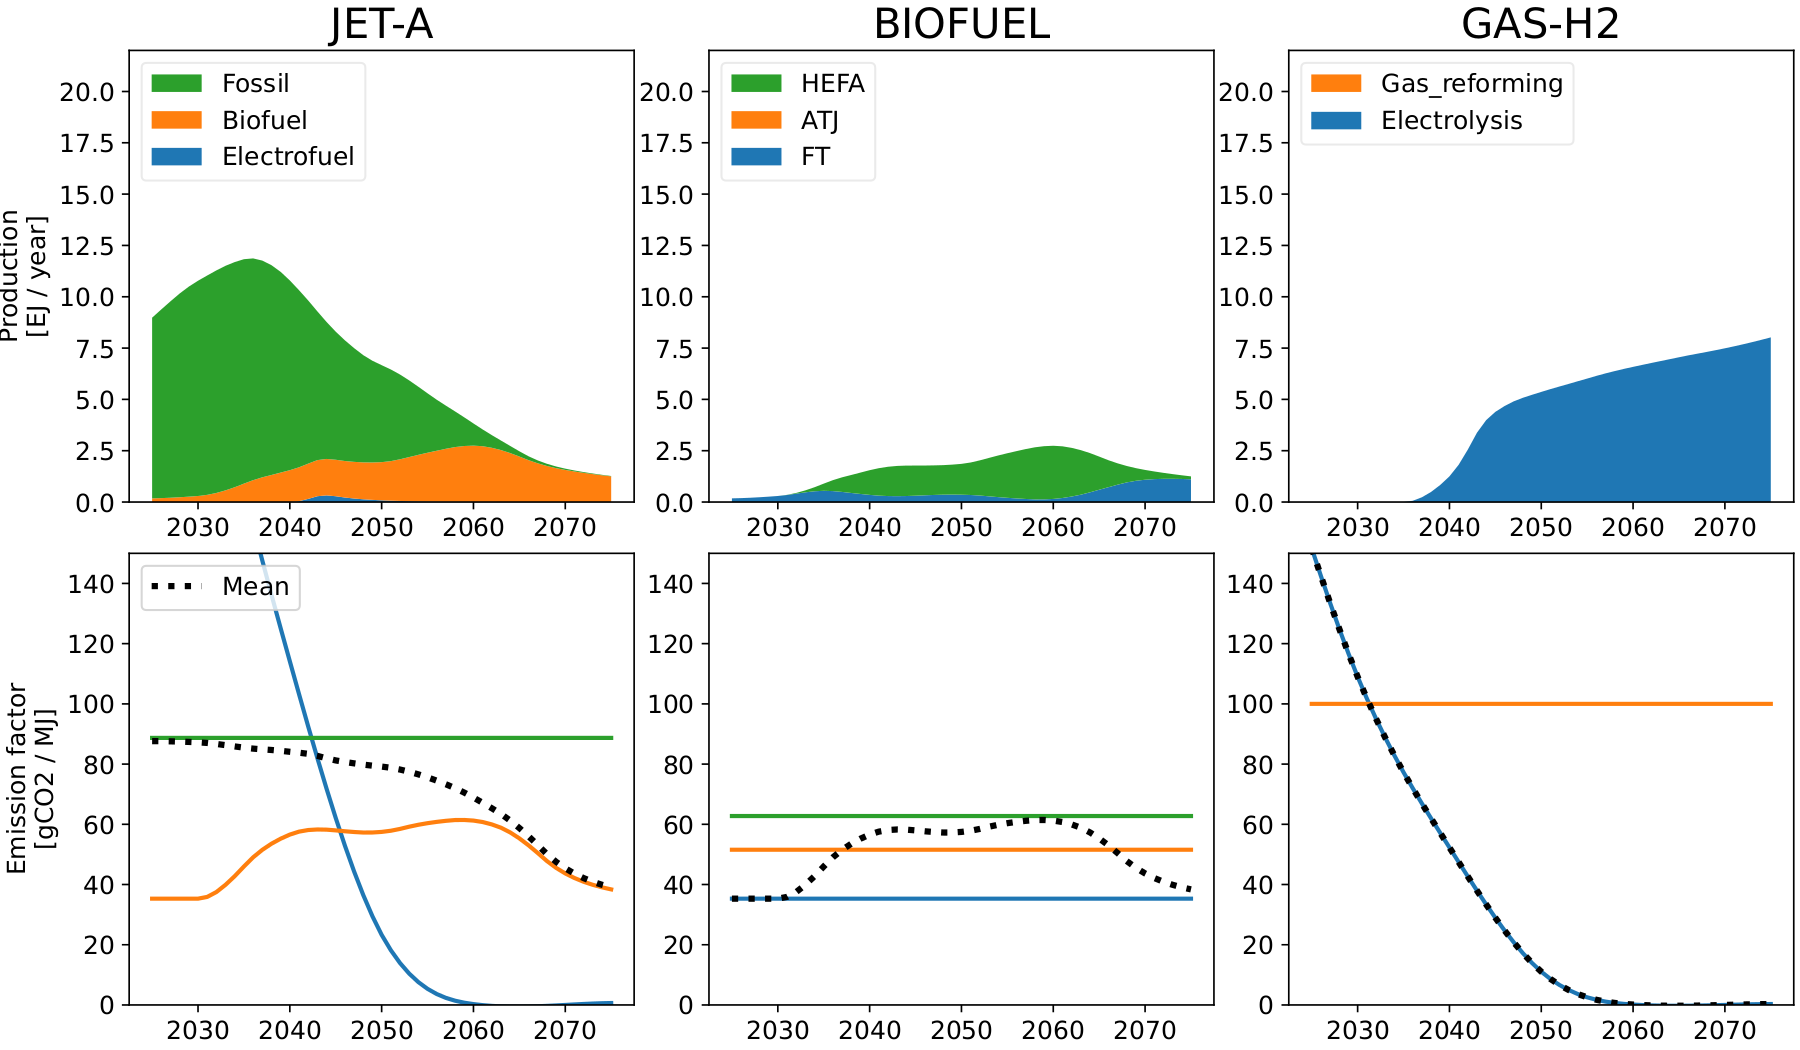
Fig. 21 and Fig. 22 compare how the Jet-A fuel is composed, blending SAF from BtL and PtL into fossil kerosene. The energy production sankey diagrams detail further how energy resources are split among production pathways in order to provide for final energy carriers, in a subset of scenarios. Regarding biofuel production, while the HEFA pathway displays significantly higher emissions compared to FT, it consumes significantly less biomass. This yields that, in scenarios where fossil kerosene consumption is still high, biomass is preferentially allocated to HEFA production. For electrofuel production, Breaktrough scenarios display much lower shares of electrofuel in the Jet-A blend, because hydrogen and electricity are preferentially allocated to alternative aircraft rather than to make electrofuel, but this trade-off is highly dependent on the flight distance considered.
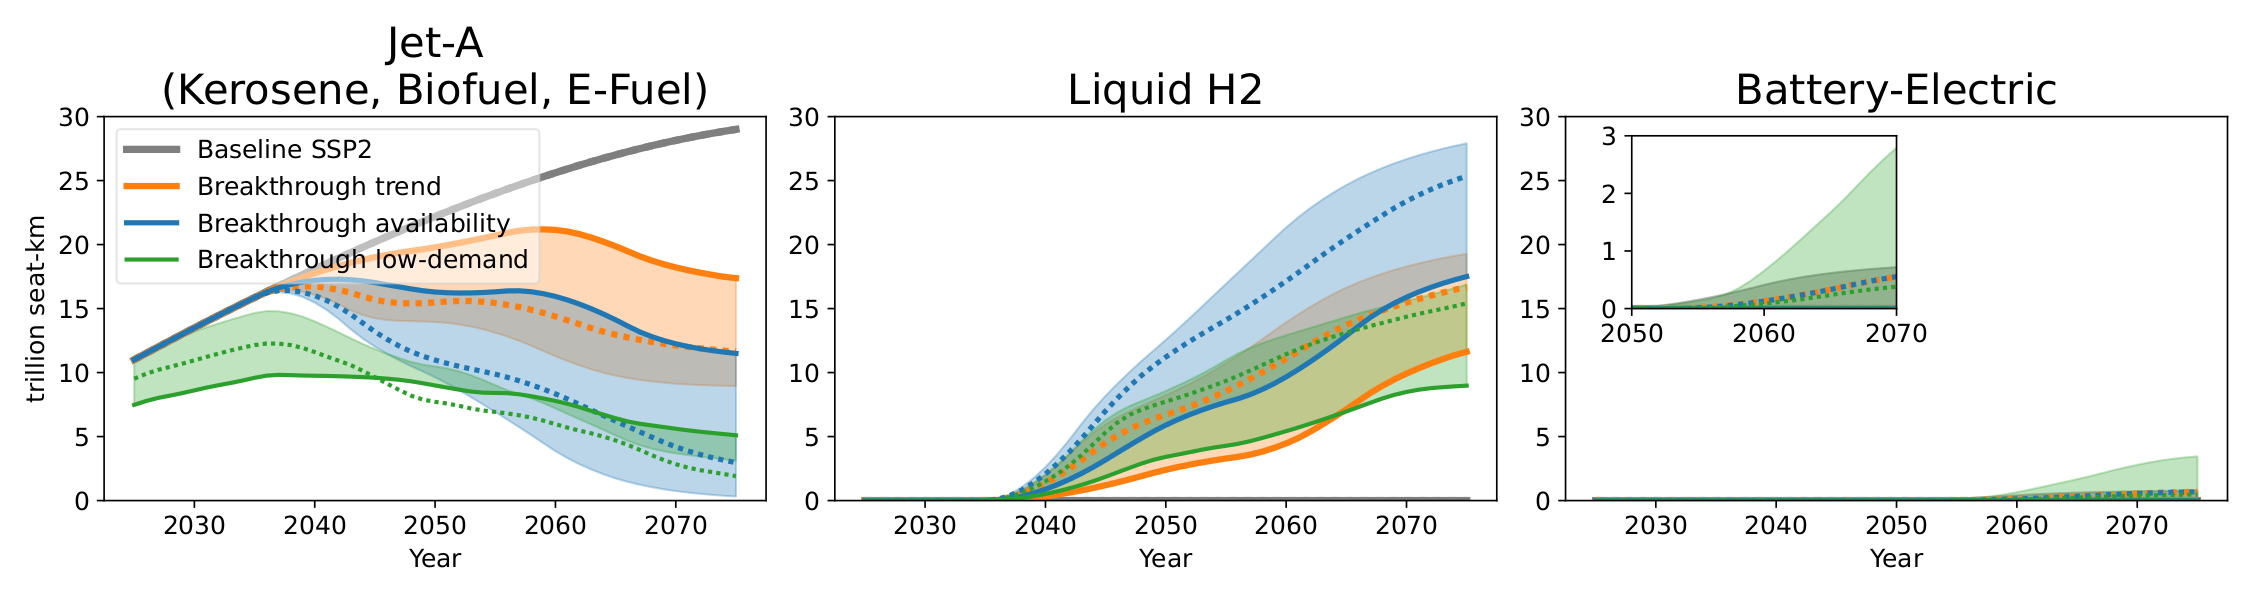
Fig. 23 Comparison of supply per final energy carrier for the Breakthrough mitigation scenarios. The sensibility to aircraft technology is displayed with 3 scenarios of component-level performances: Lower technology (continuous line), Mid technology (dotted line), and Upper technology (shadowed region). These impact the performance of current aircraft, new aircraft, and the speed of fleet renewal, driving the choice of which architectures to deploy and when they are launched.#
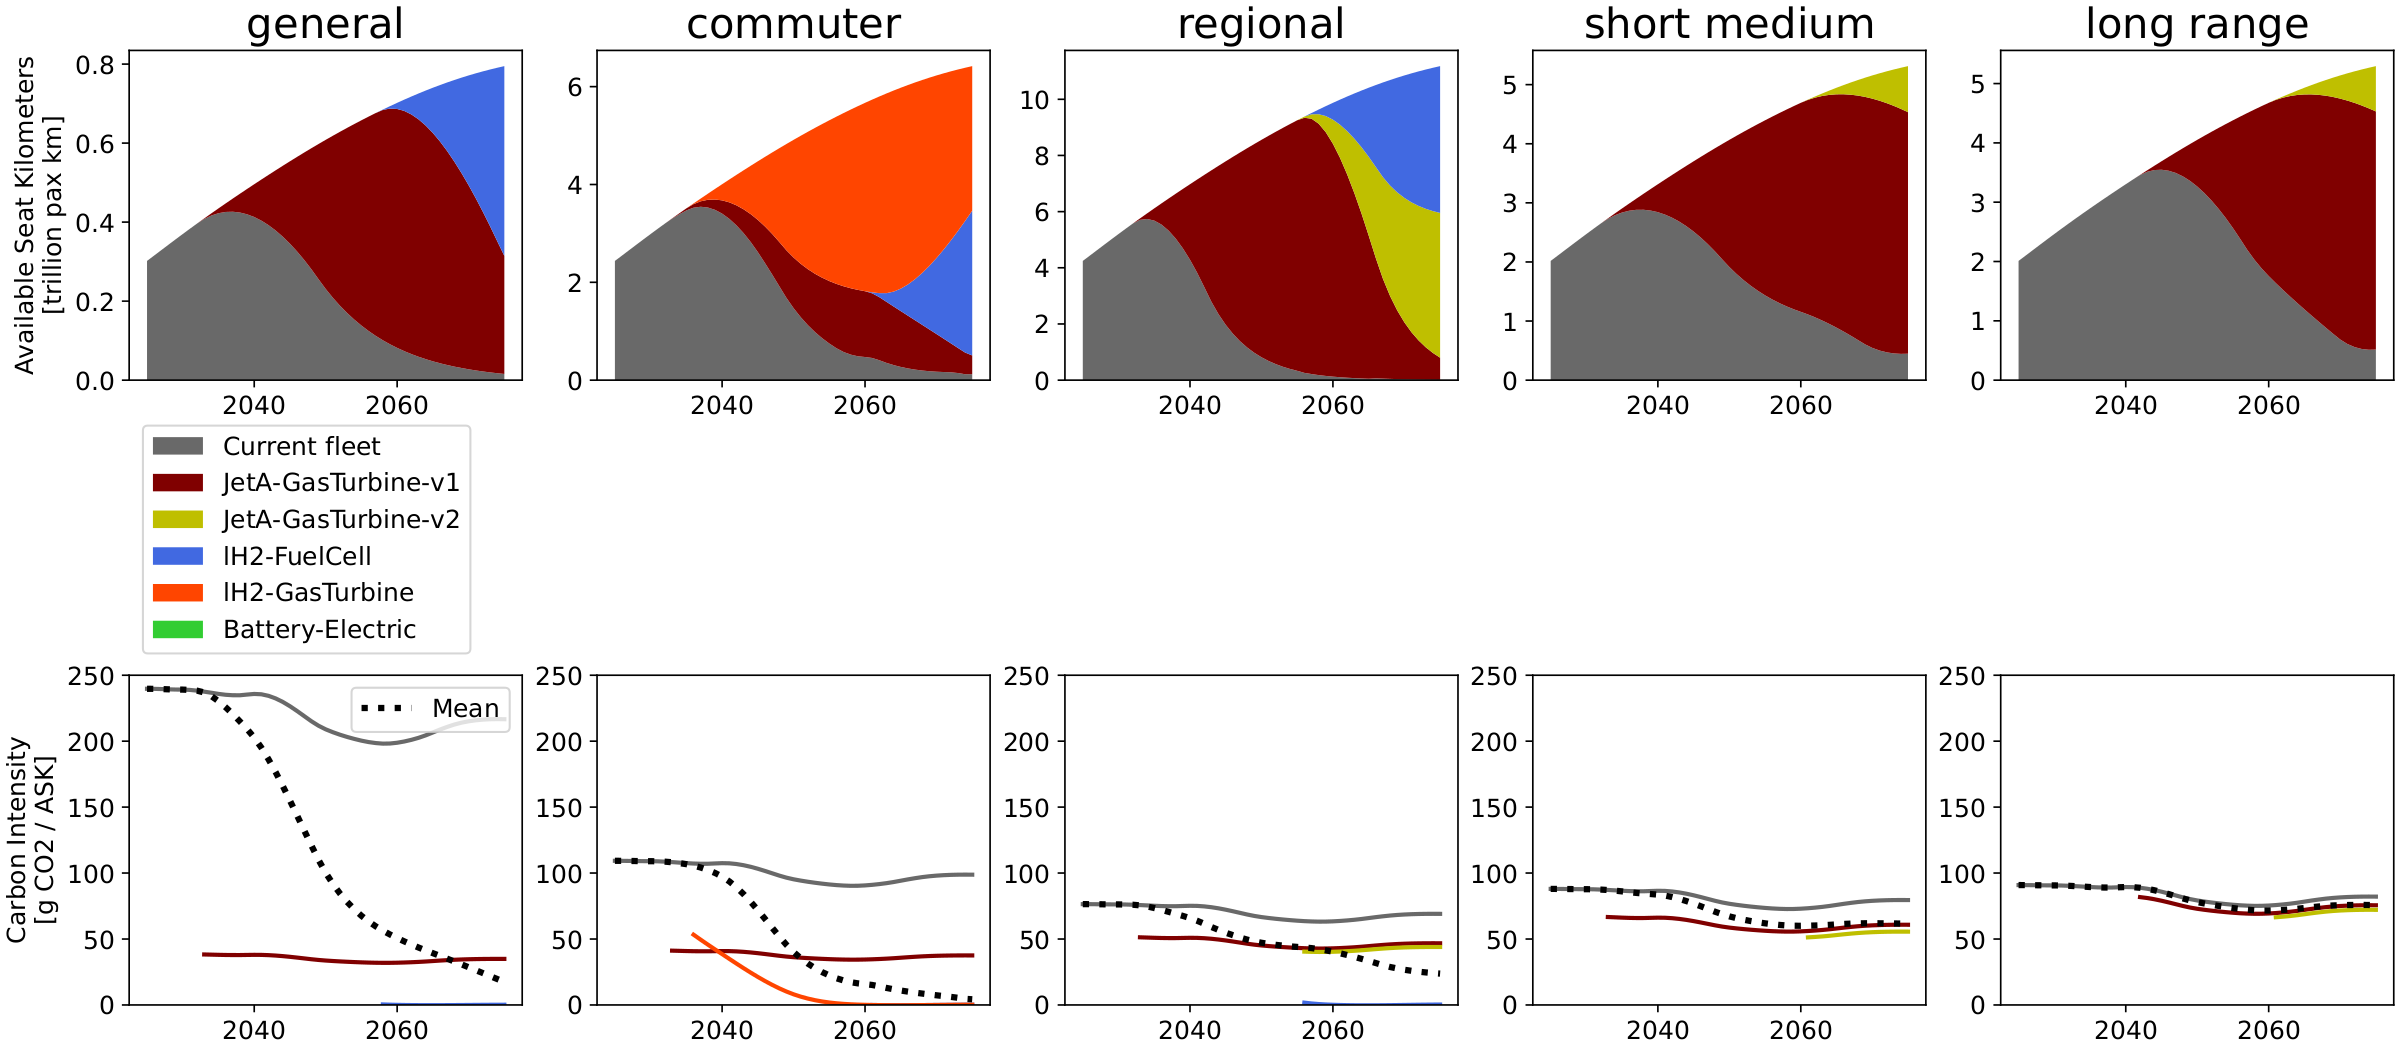
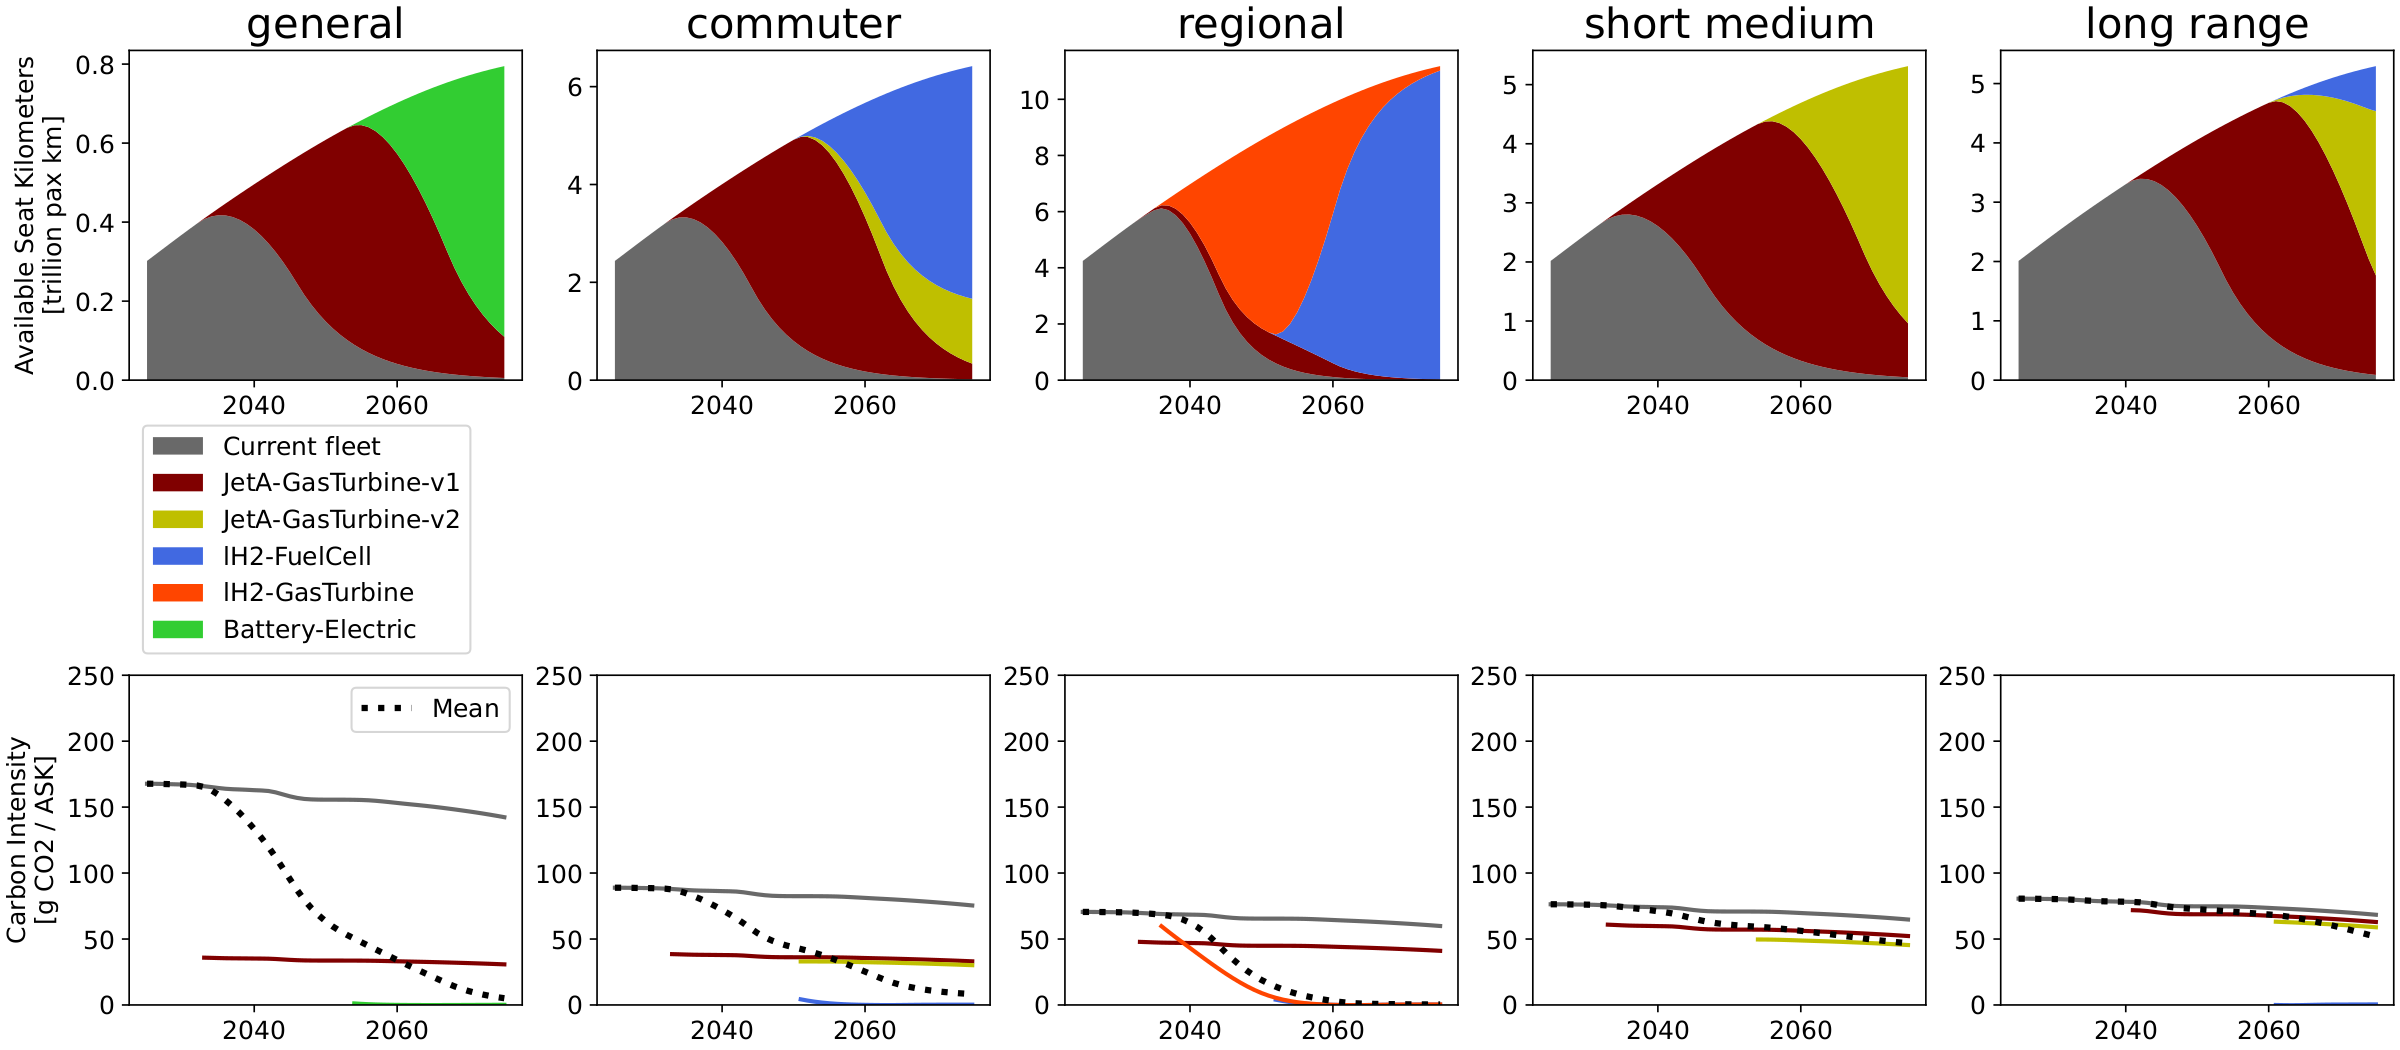
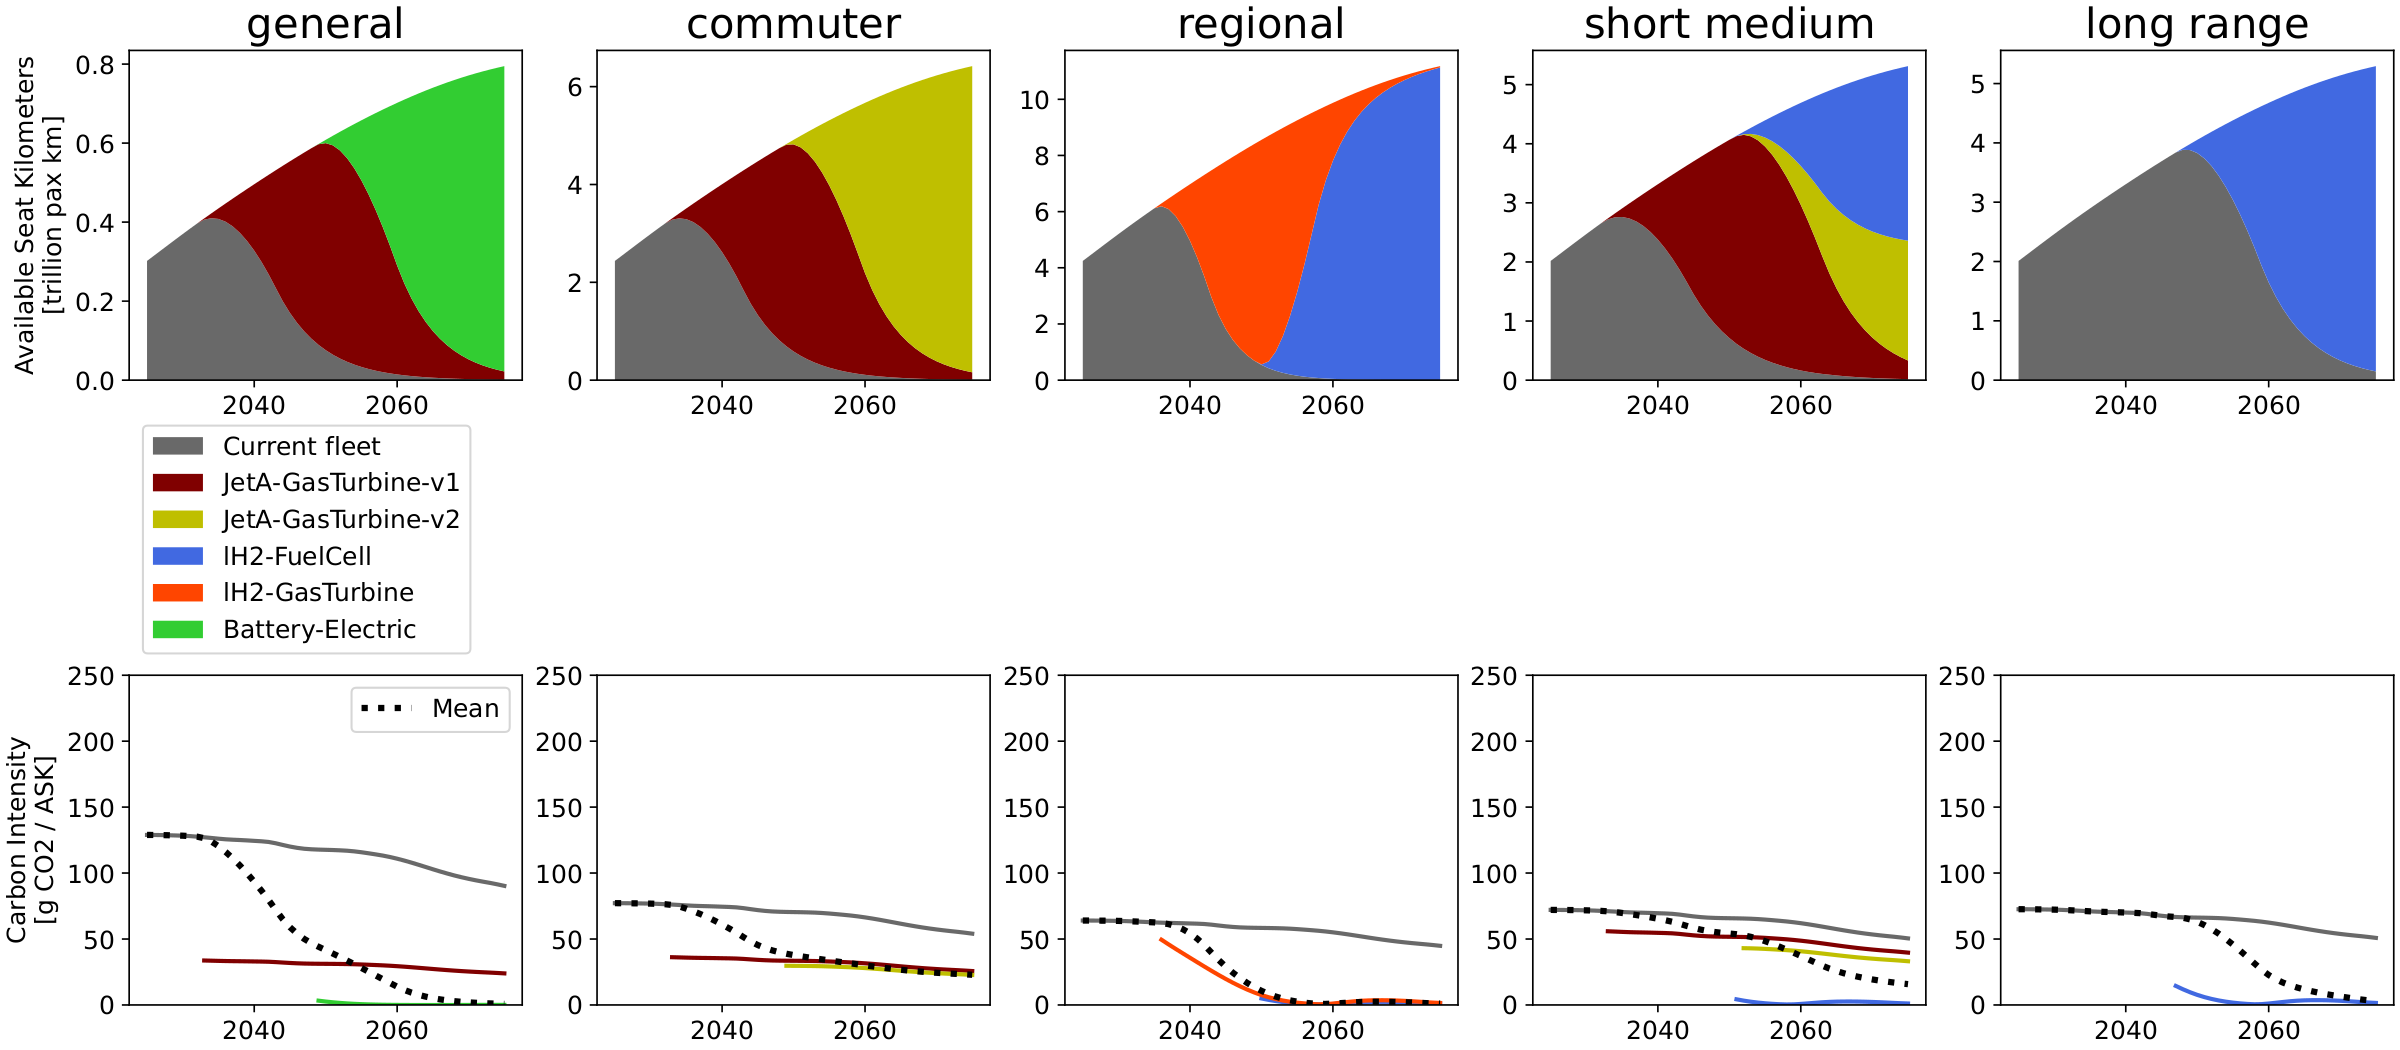
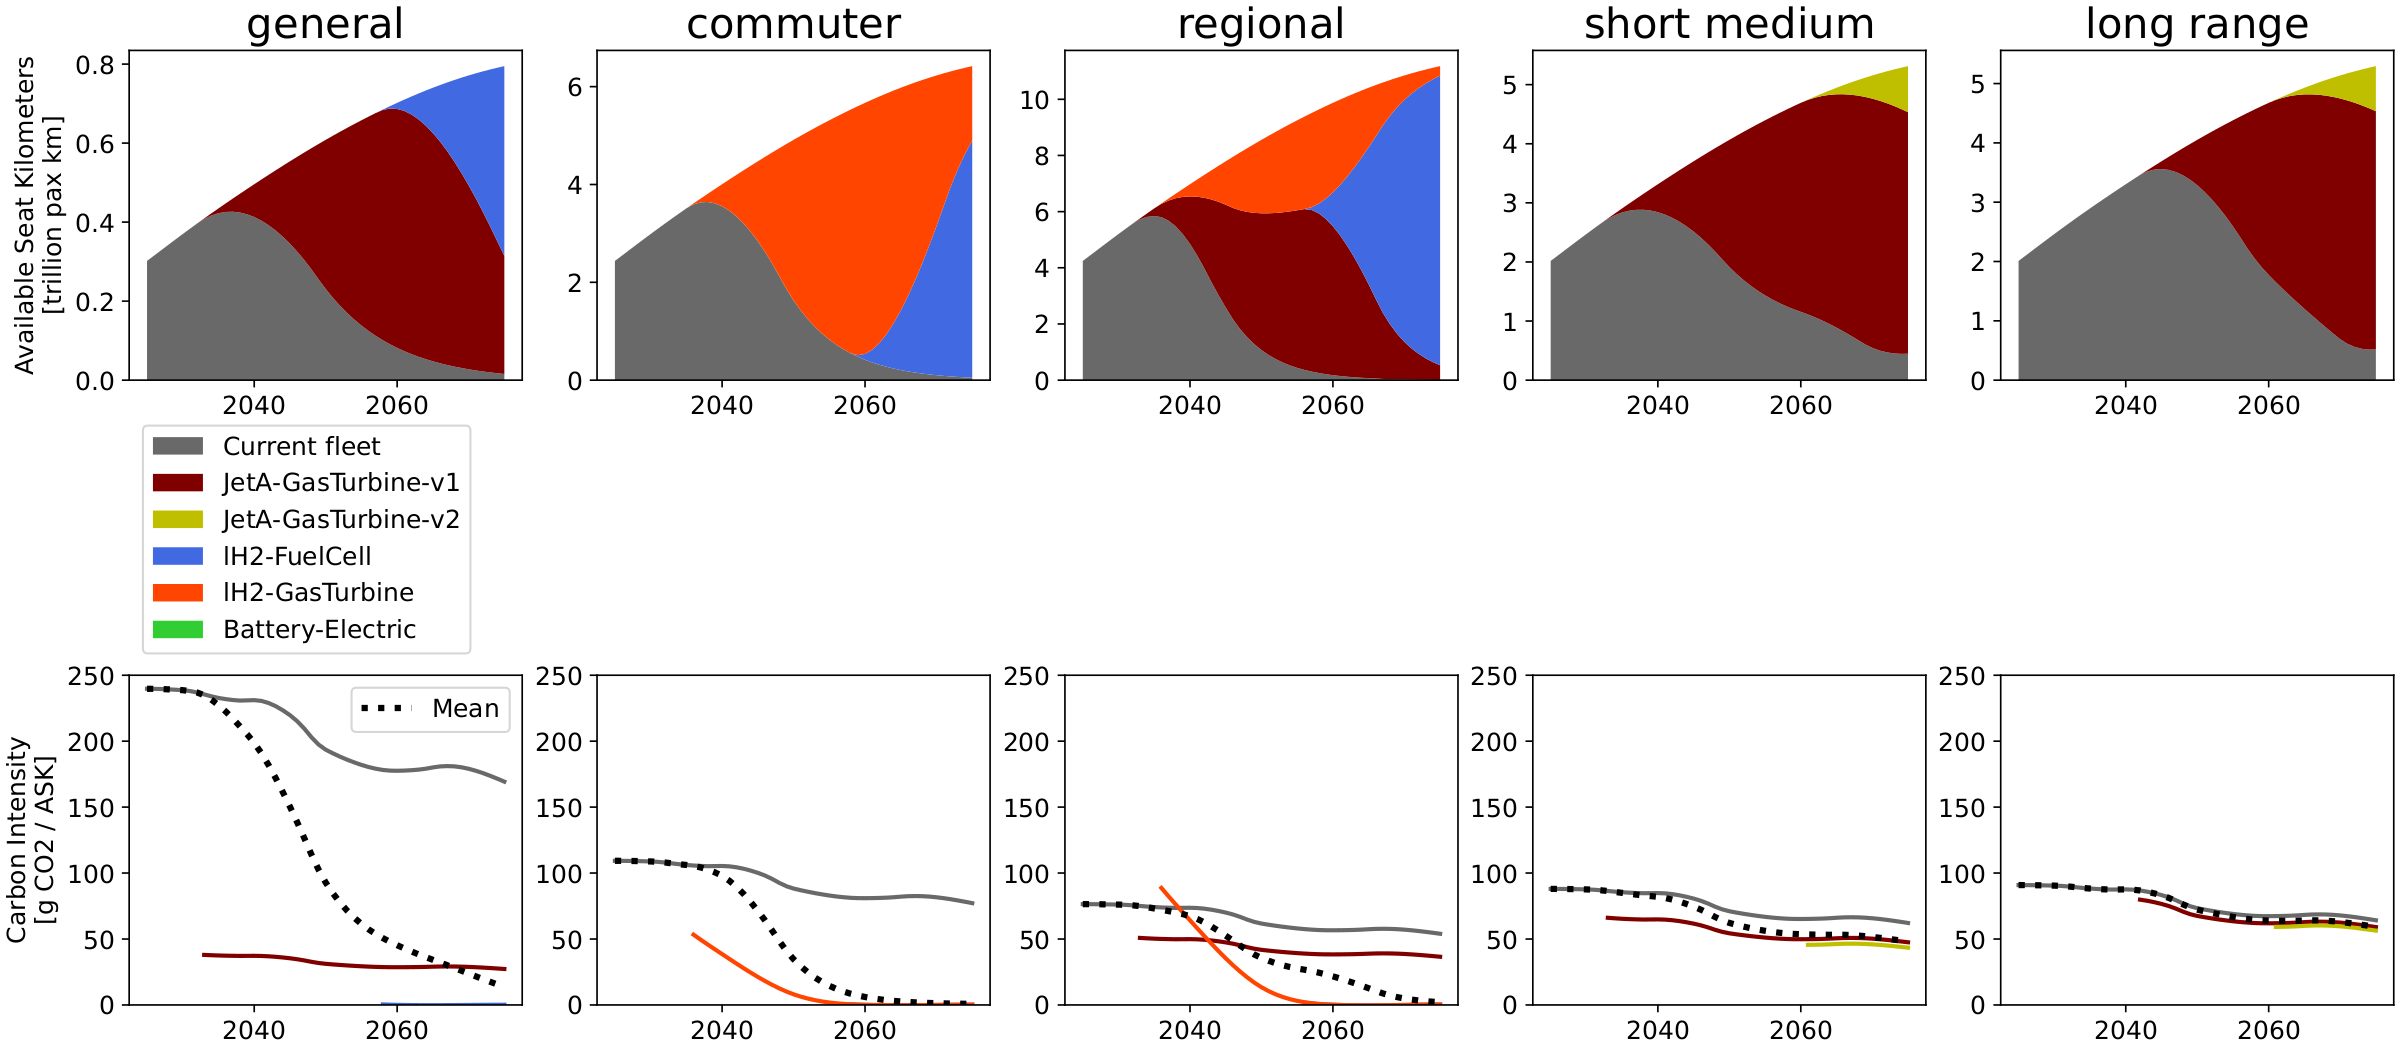
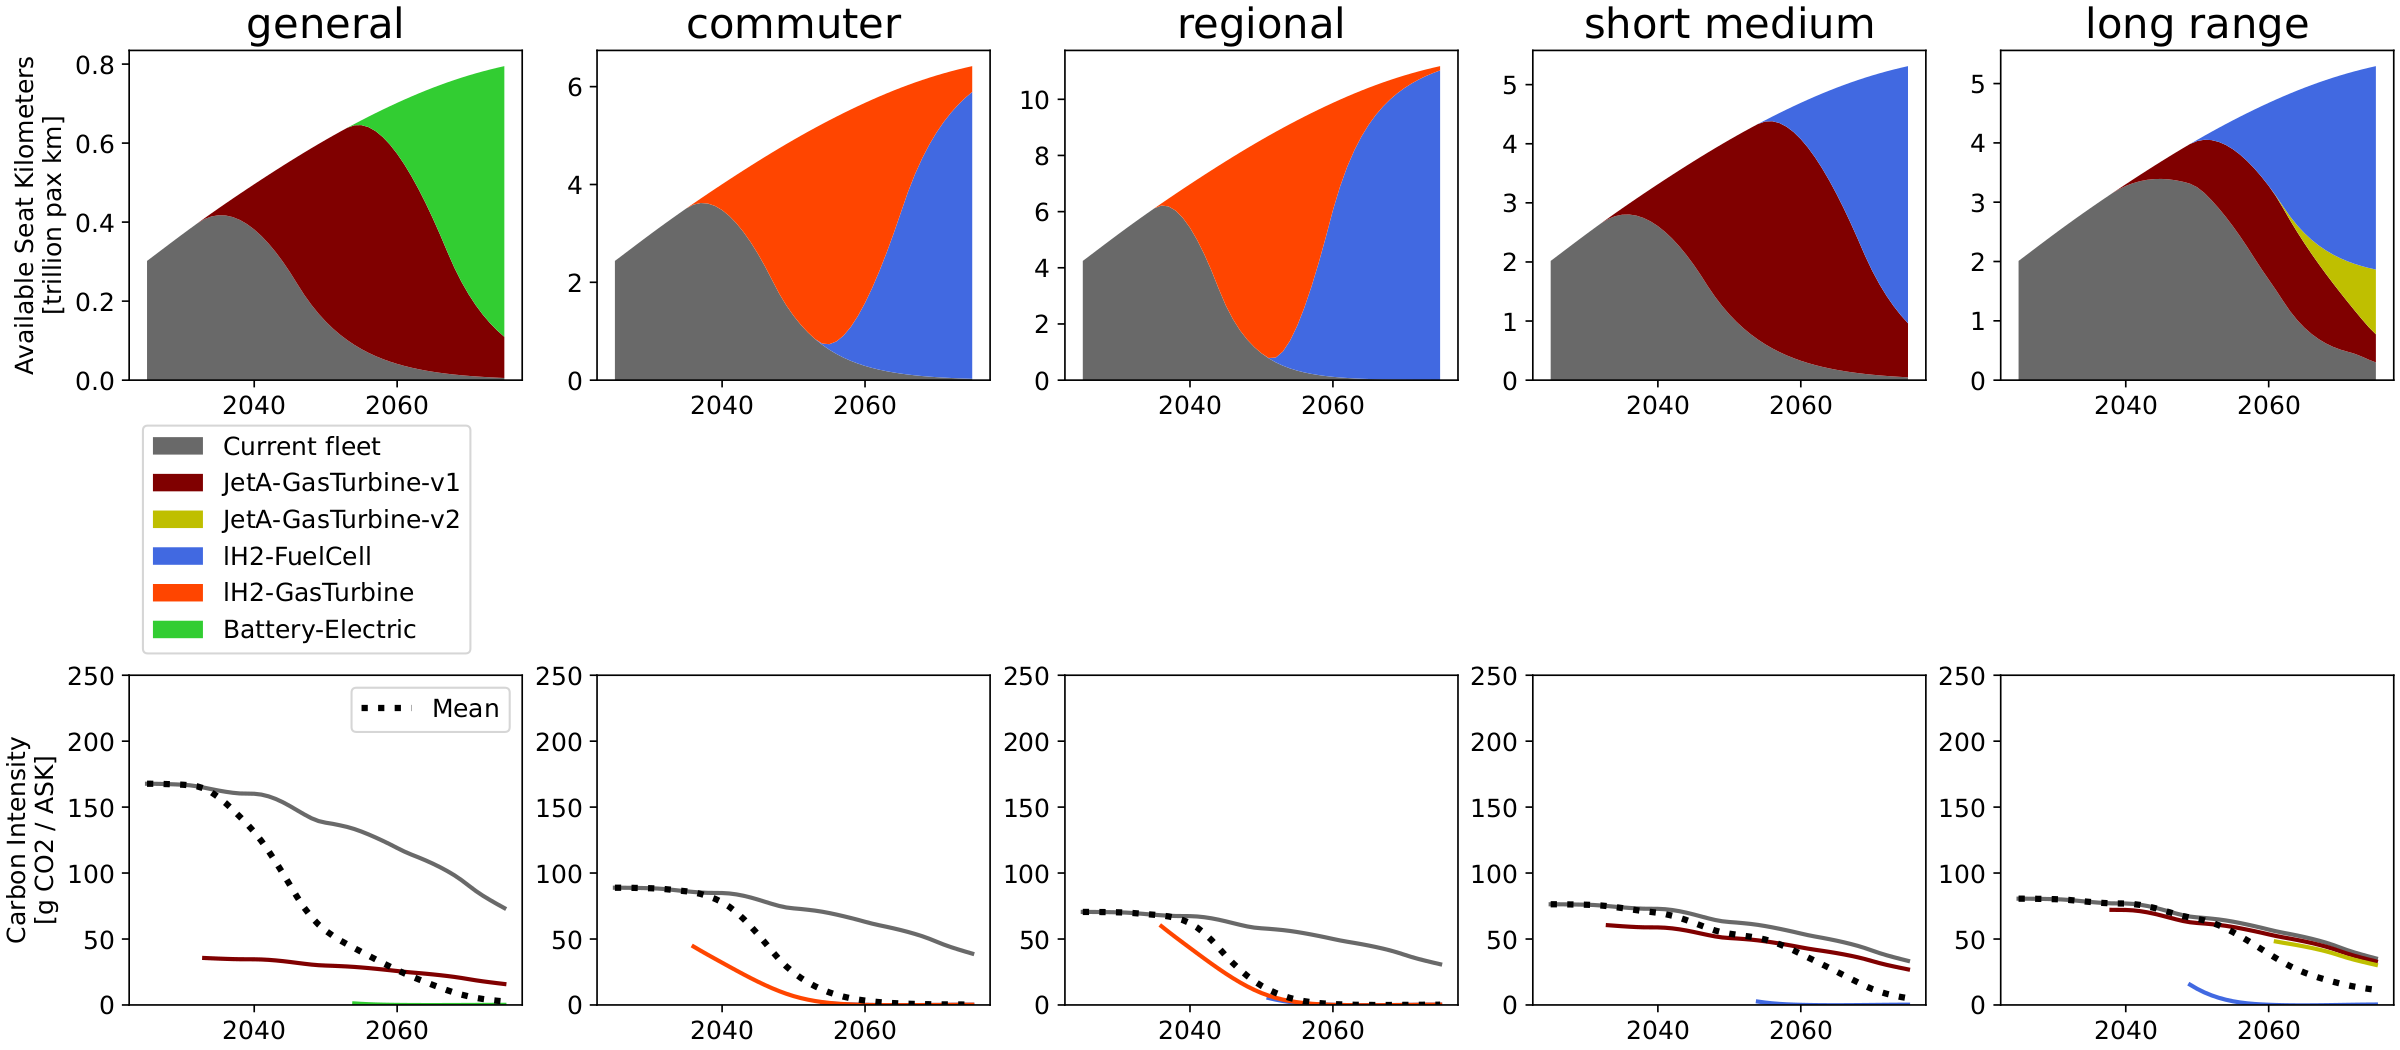
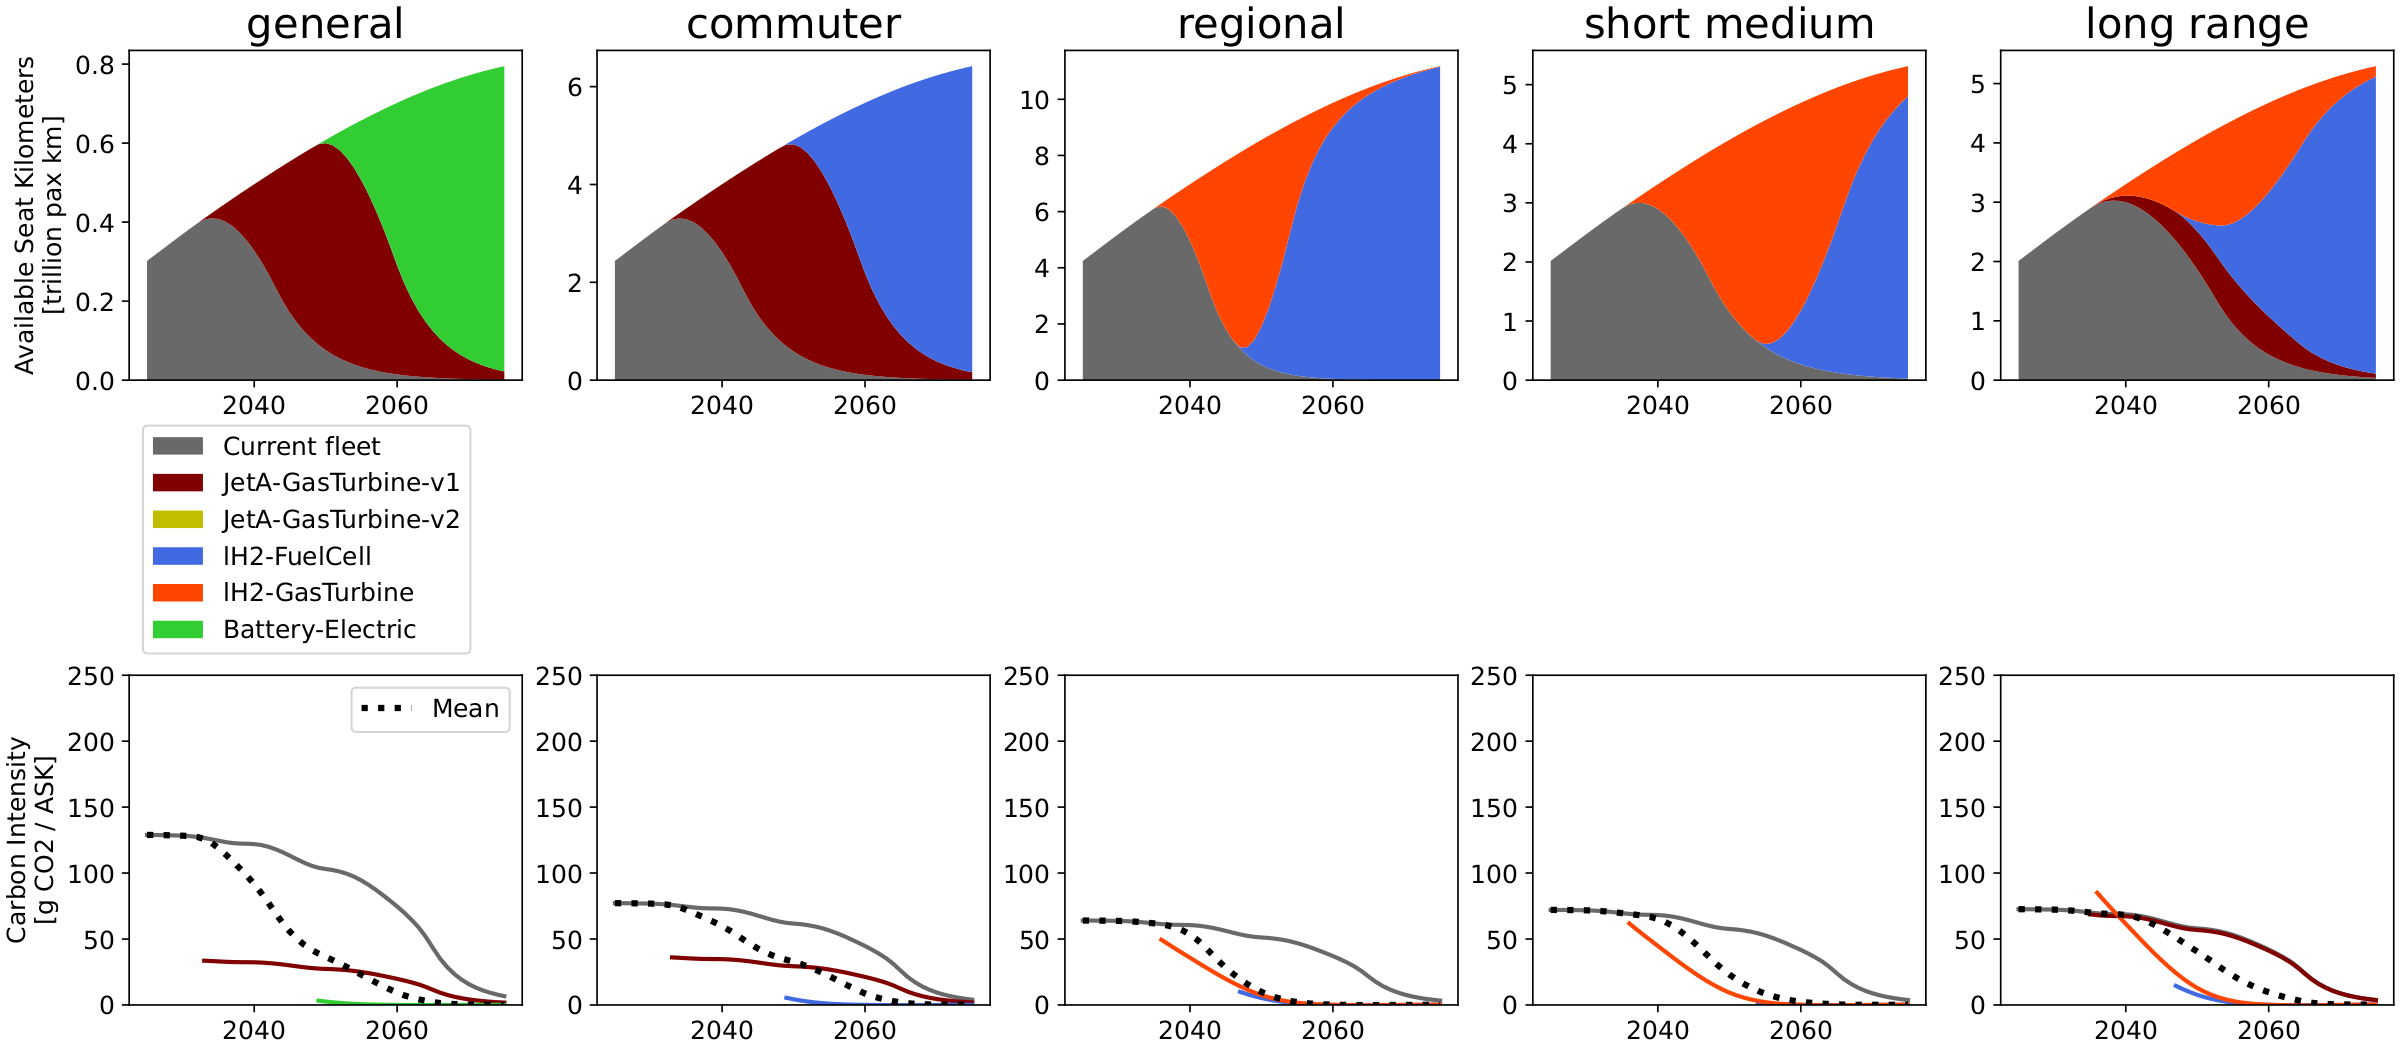
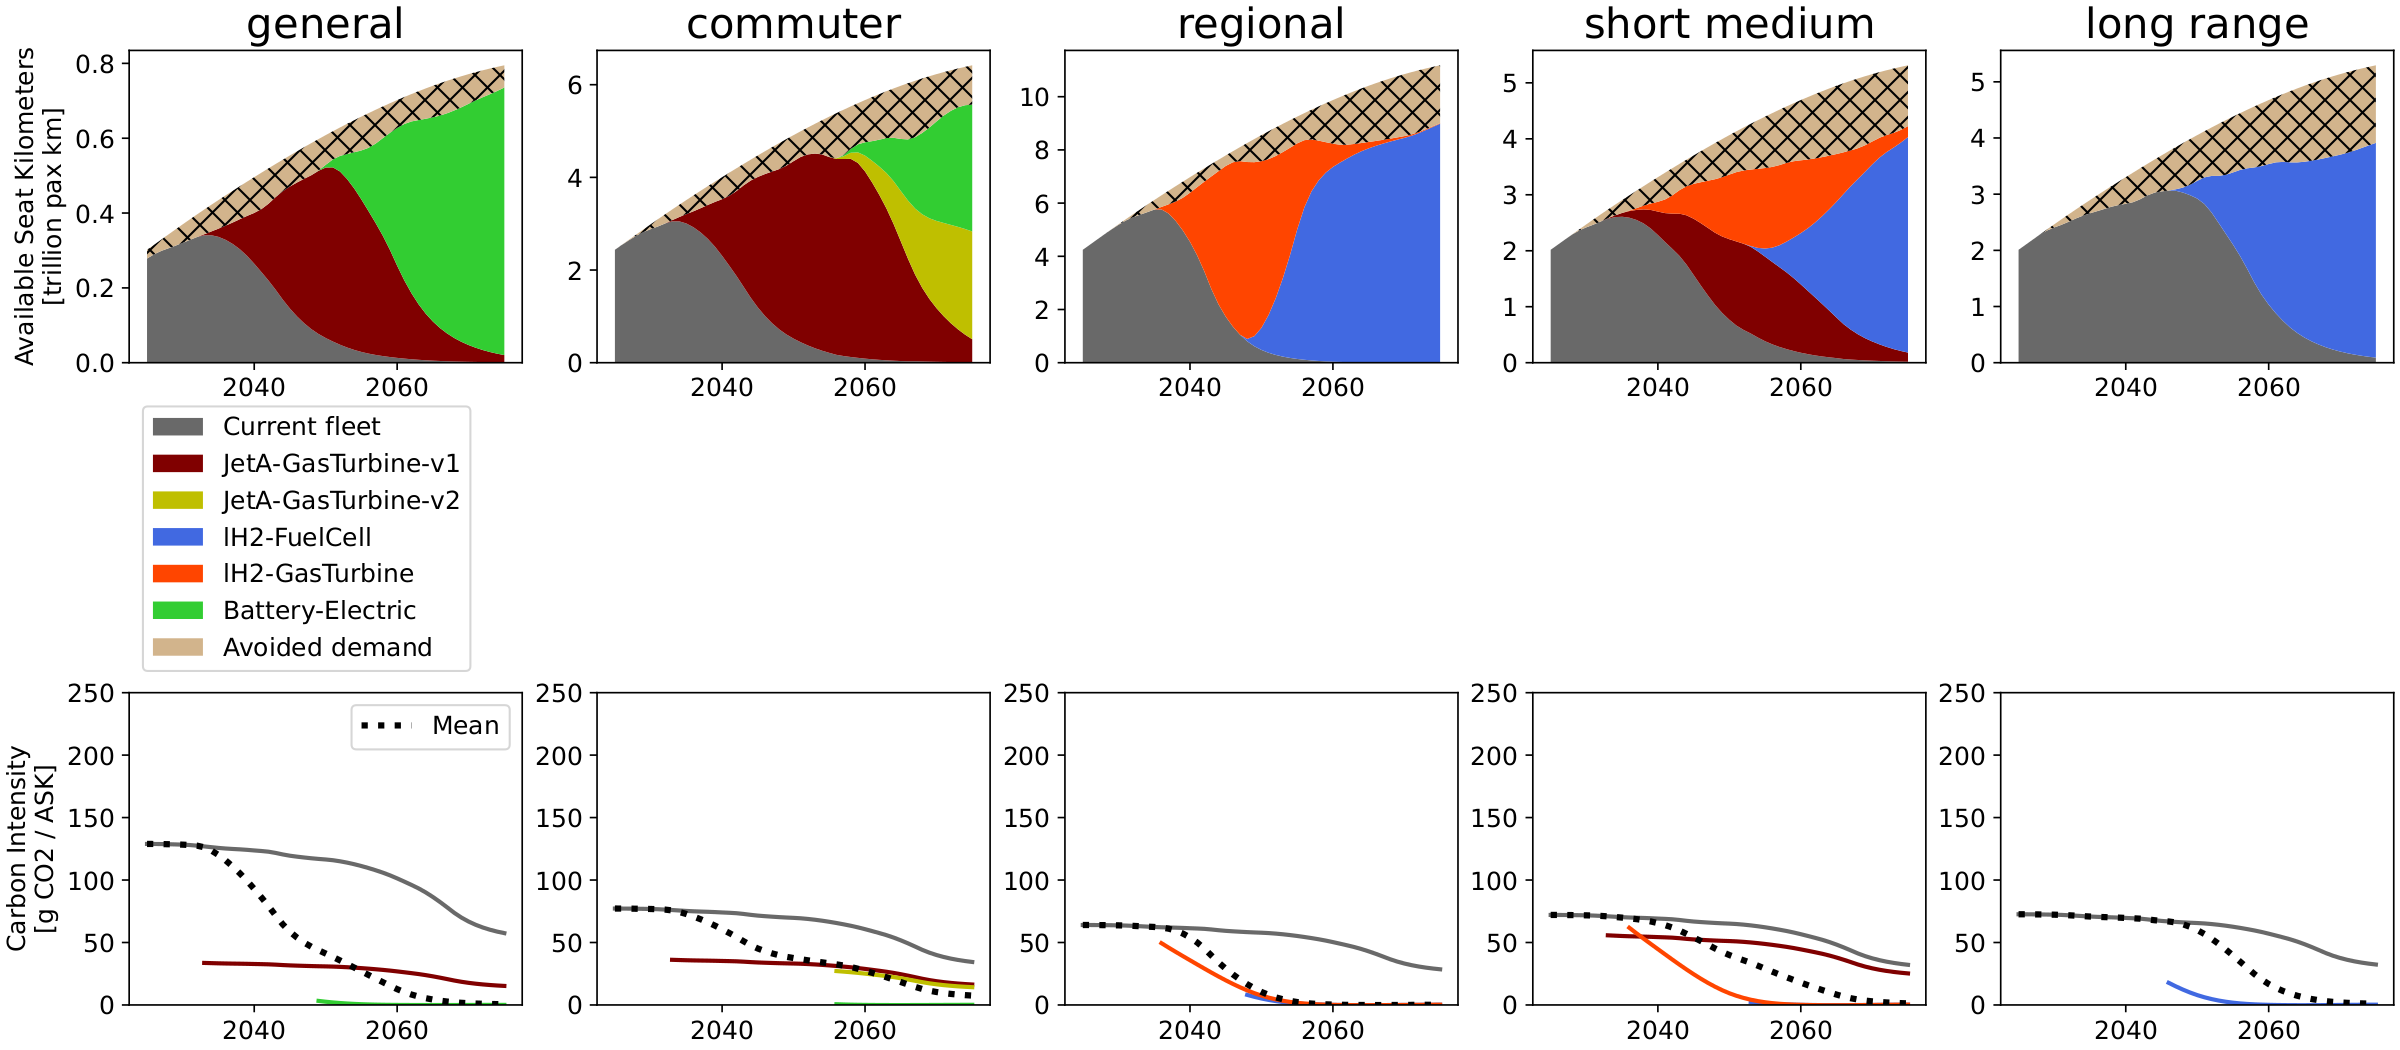
Regarding the aircraft fleet, Fig. 23 shows the overall comparison of supply according to final energy carrier, while Fig. 24 to Fig. 29 provide the bottom-up view of how aircraft technologies are composed to make up the supply in each market segment. The general and commuter markets are consistently the first to transition toward new aircraft, whereas short-medium and long-range markets remain dependent on drop-in fuels for longer periods. The Breakthrough scenarios demonstrate the importance of both technological maturity and availability assumptions: Lower technology delay deployment of hydrogen systems, but once extra energy availability is assumed alternative aircraft are launched as soon as available. In contrast, the Upper technology case allows for more aggressive displacement of conventional aircraft, and also drive the adoption of Battery-Electric in the general market and of Hydrogen Fuel-Cells on remaining markets.
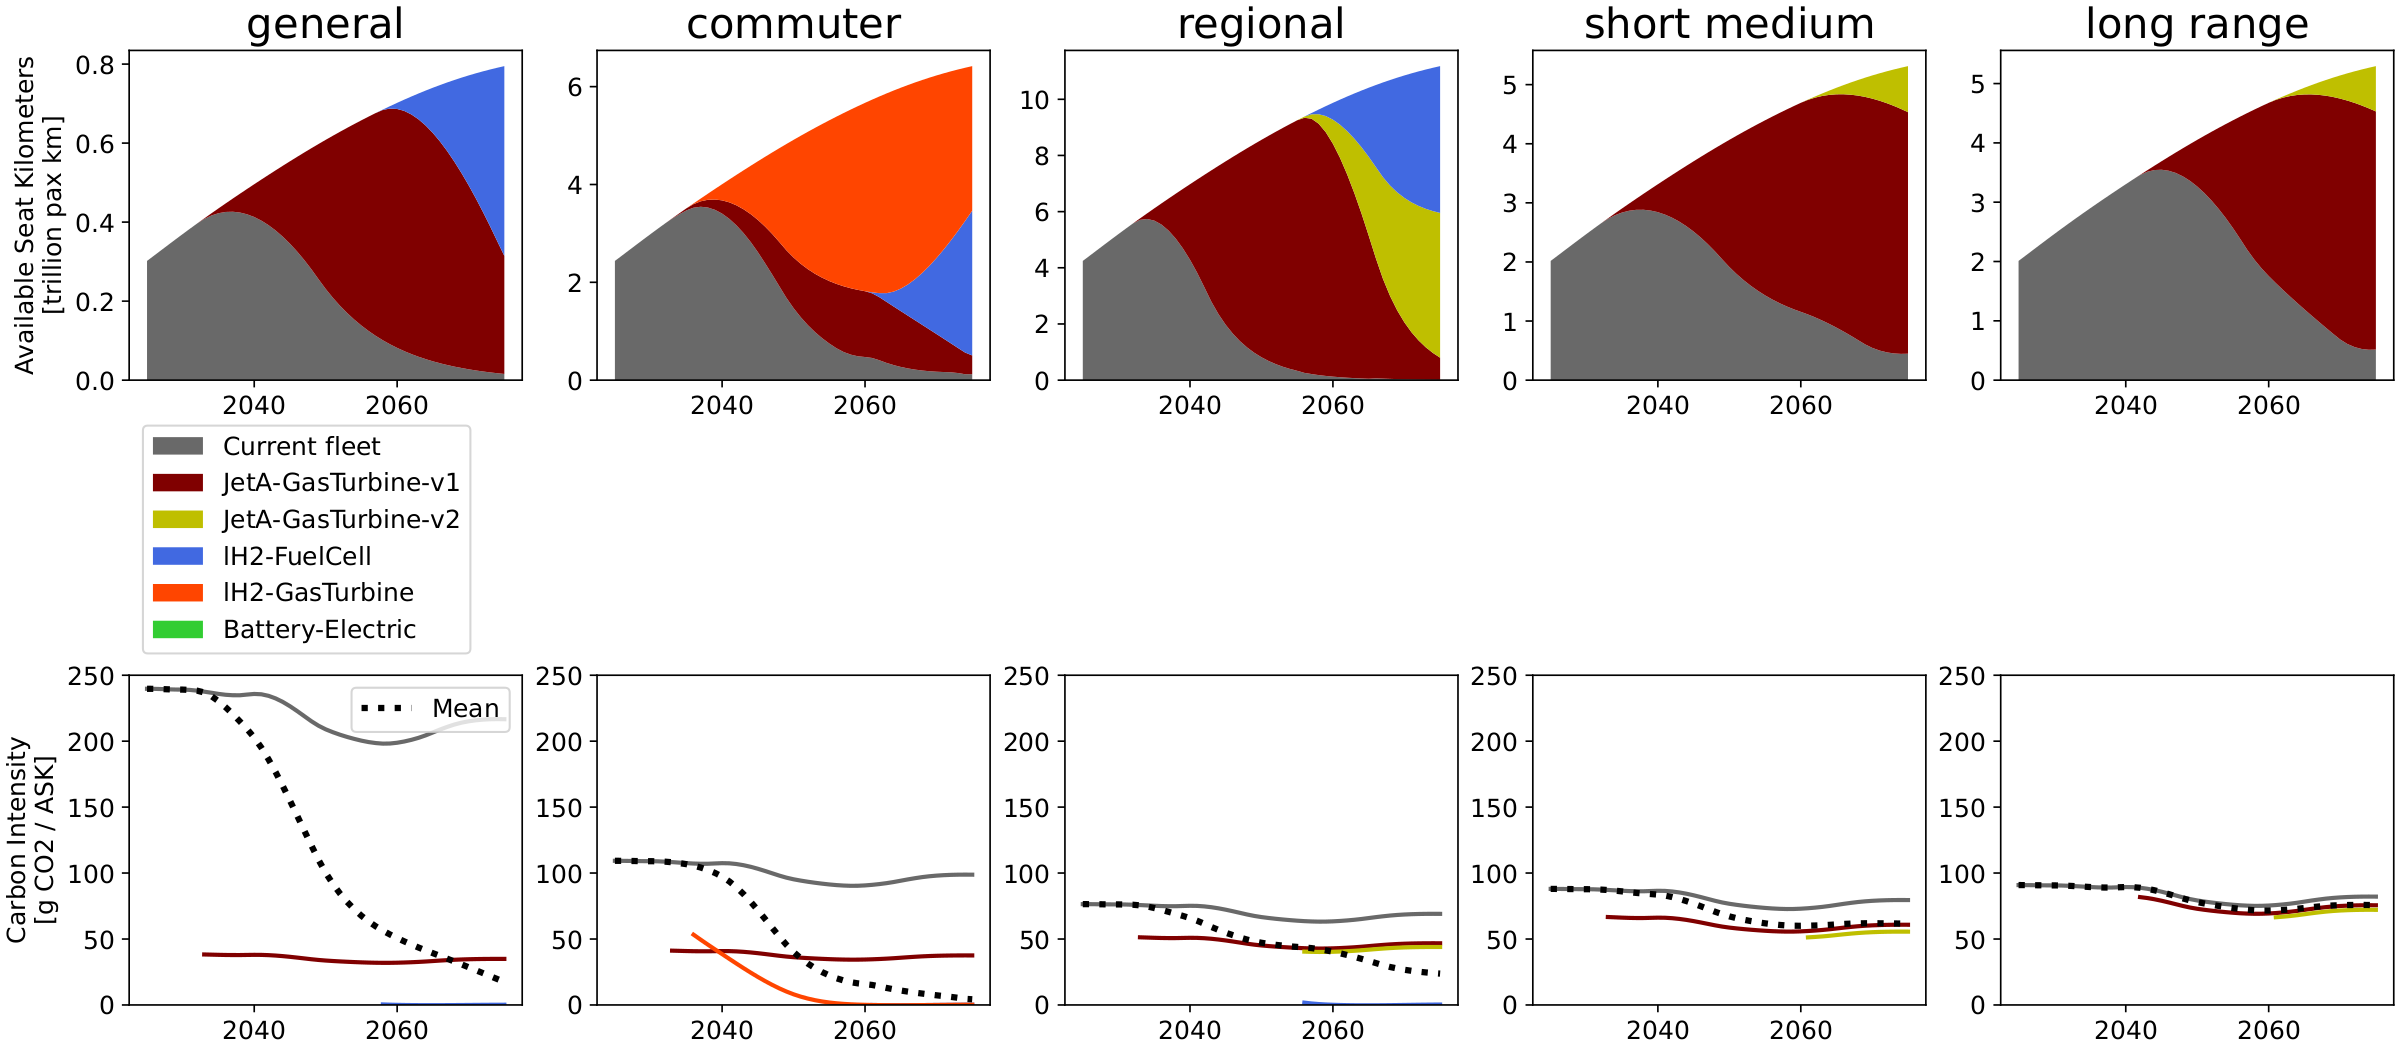
Fig. 24 Aircraft fleet composition per market: Breakthrough trend, Lower technology.#
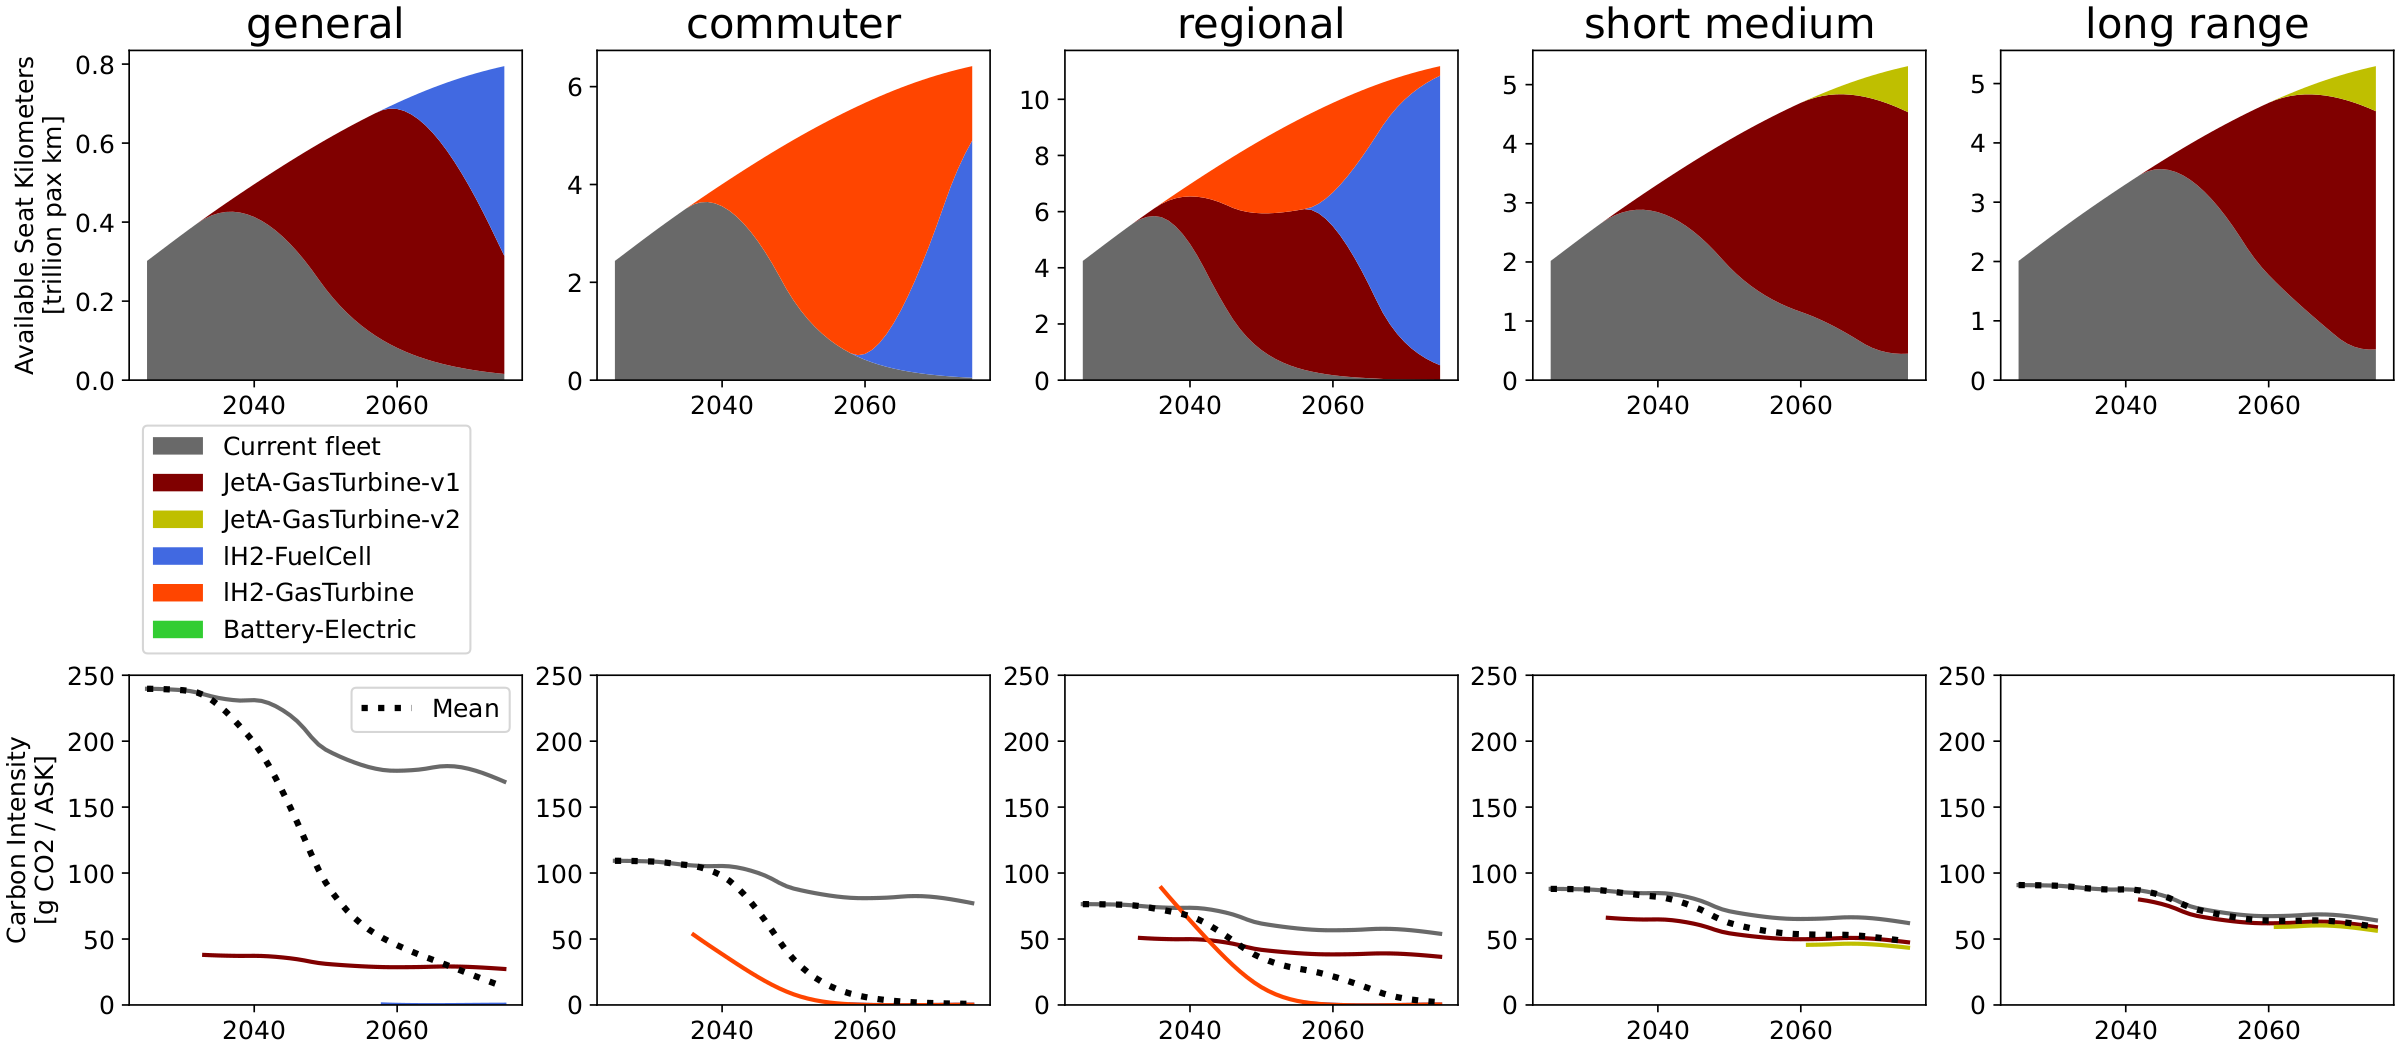
Fig. 25 Aircraft fleet composition per market: Breakthrough availability, Lower technology.#
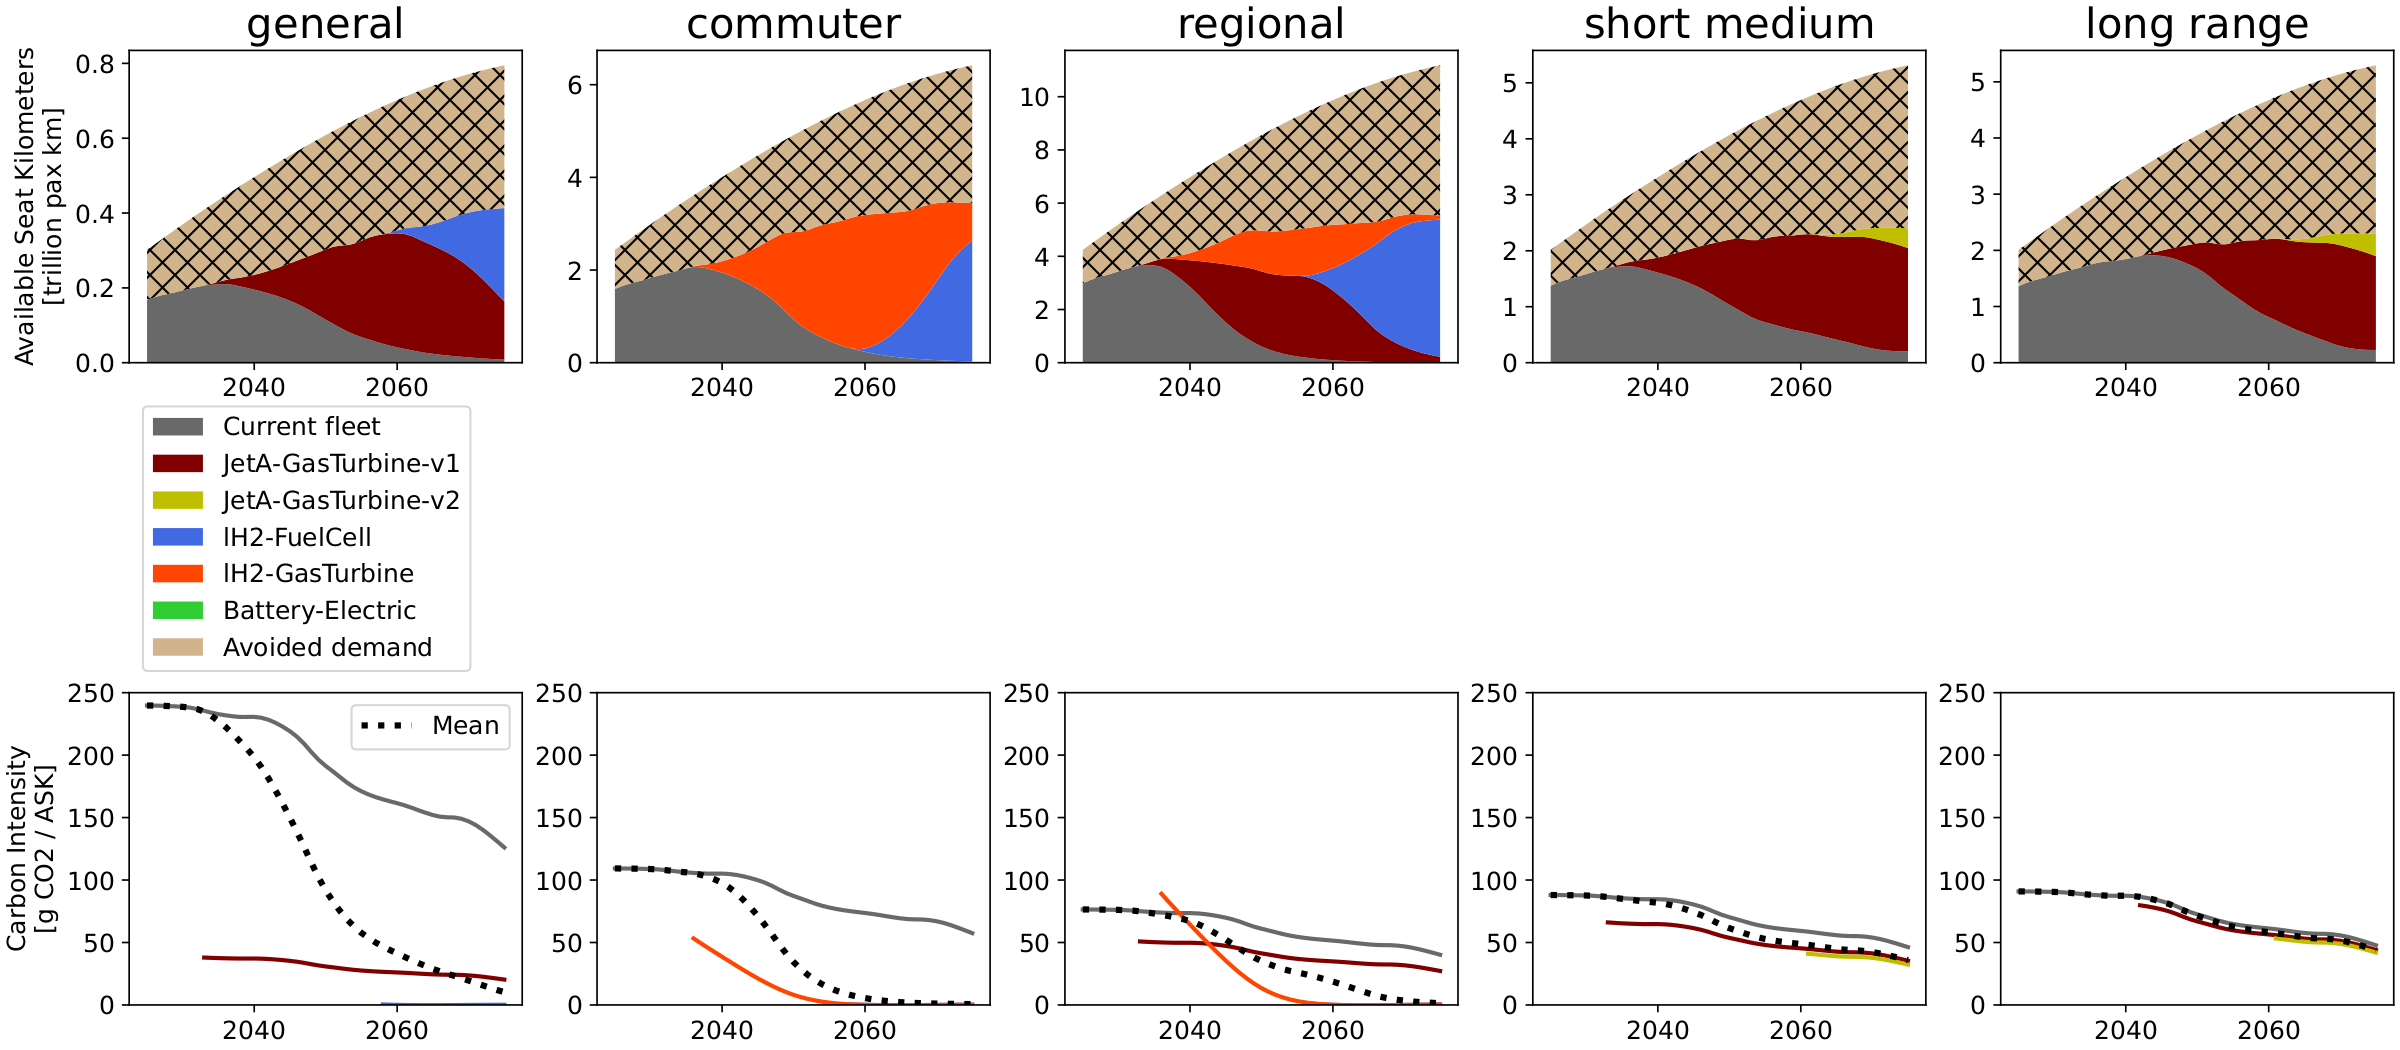
Fig. 26 Aircraft fleet composition per market: Breakthrough low-demand, Lower technology.#
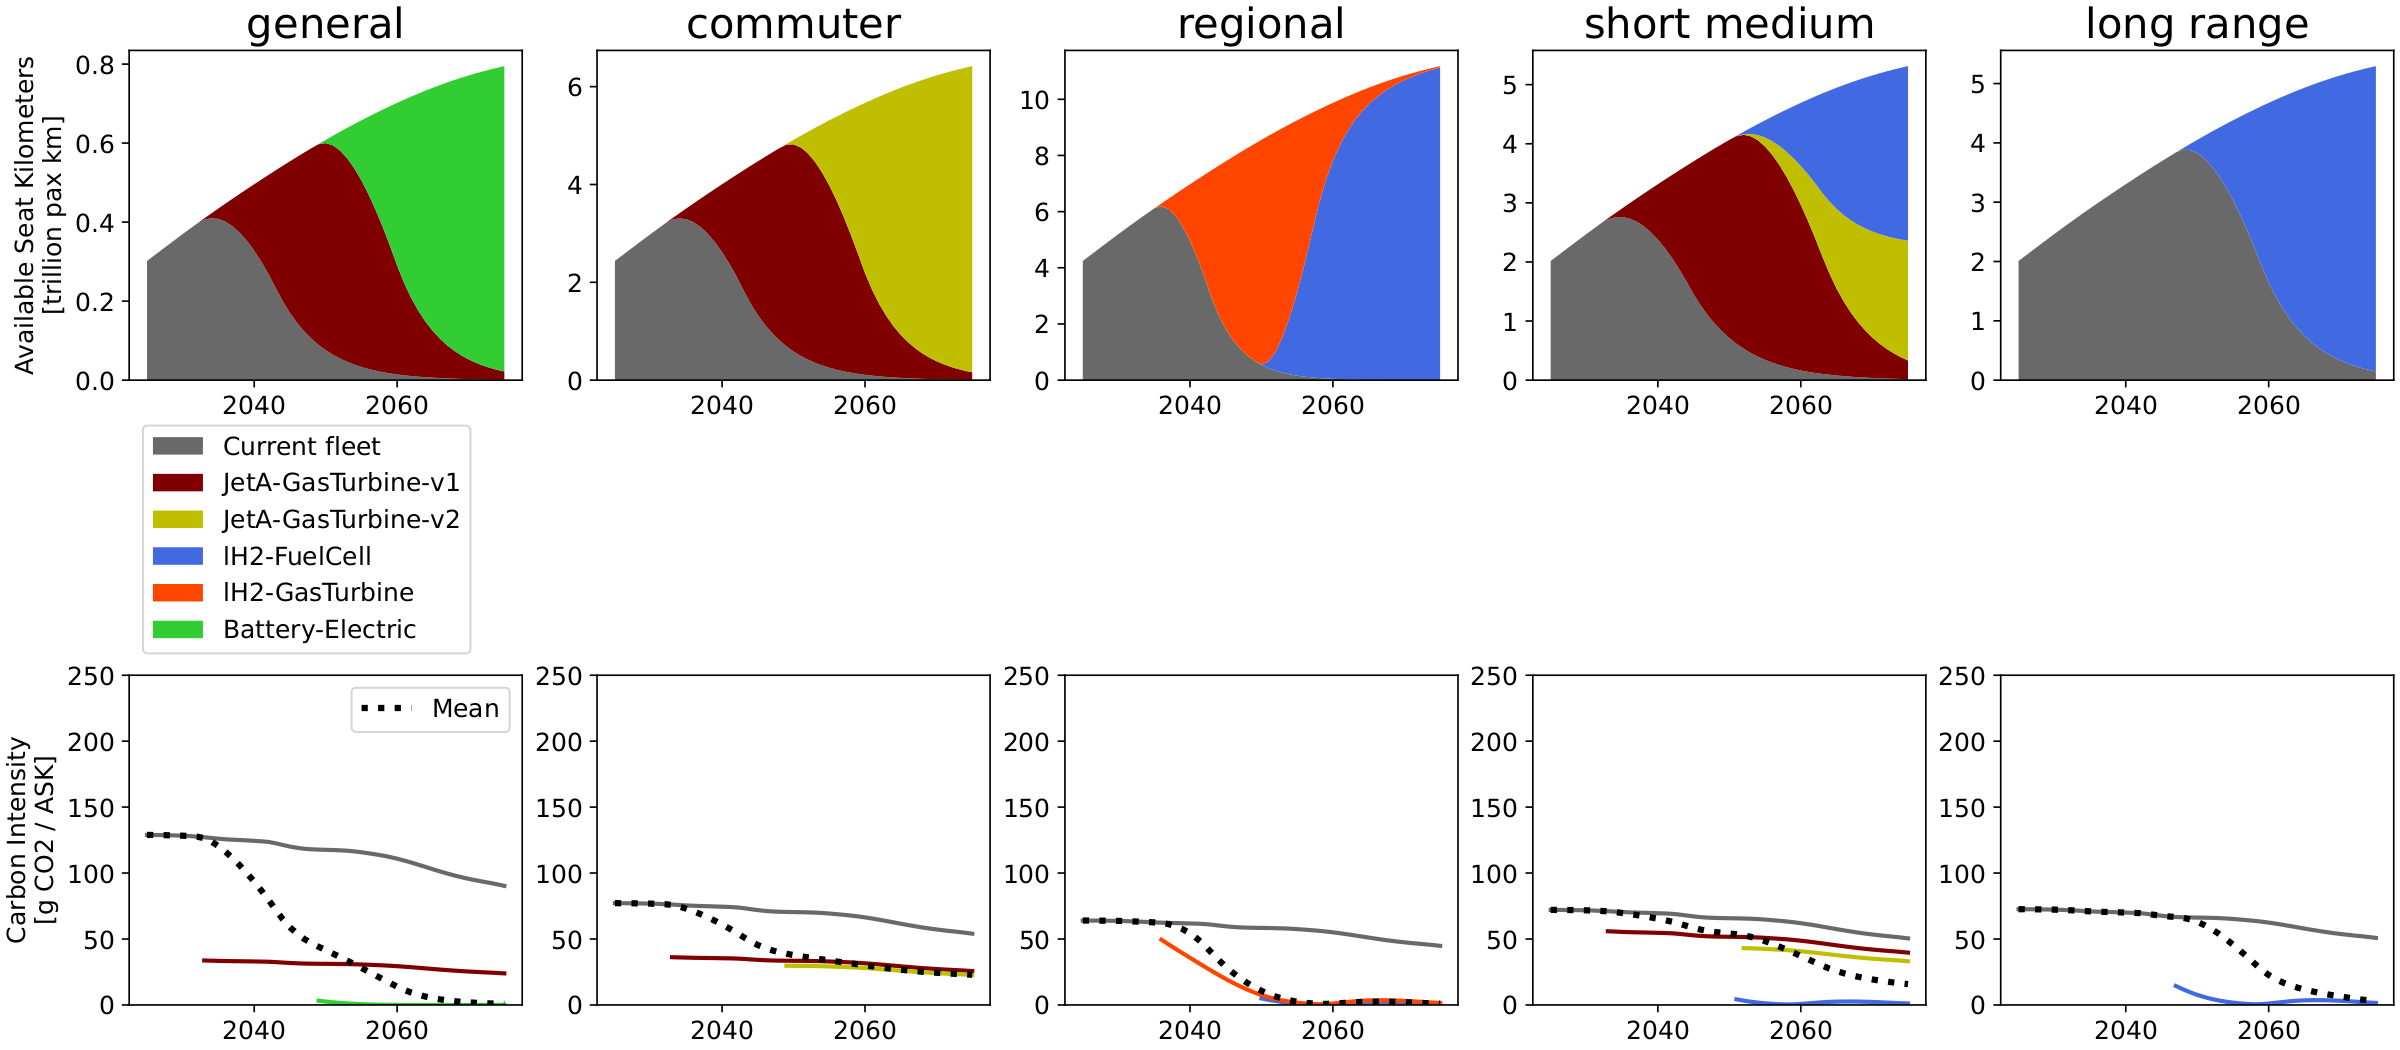
Fig. 27 Aircraft fleet composition per market: Breakthrough trend, Upper technology.#
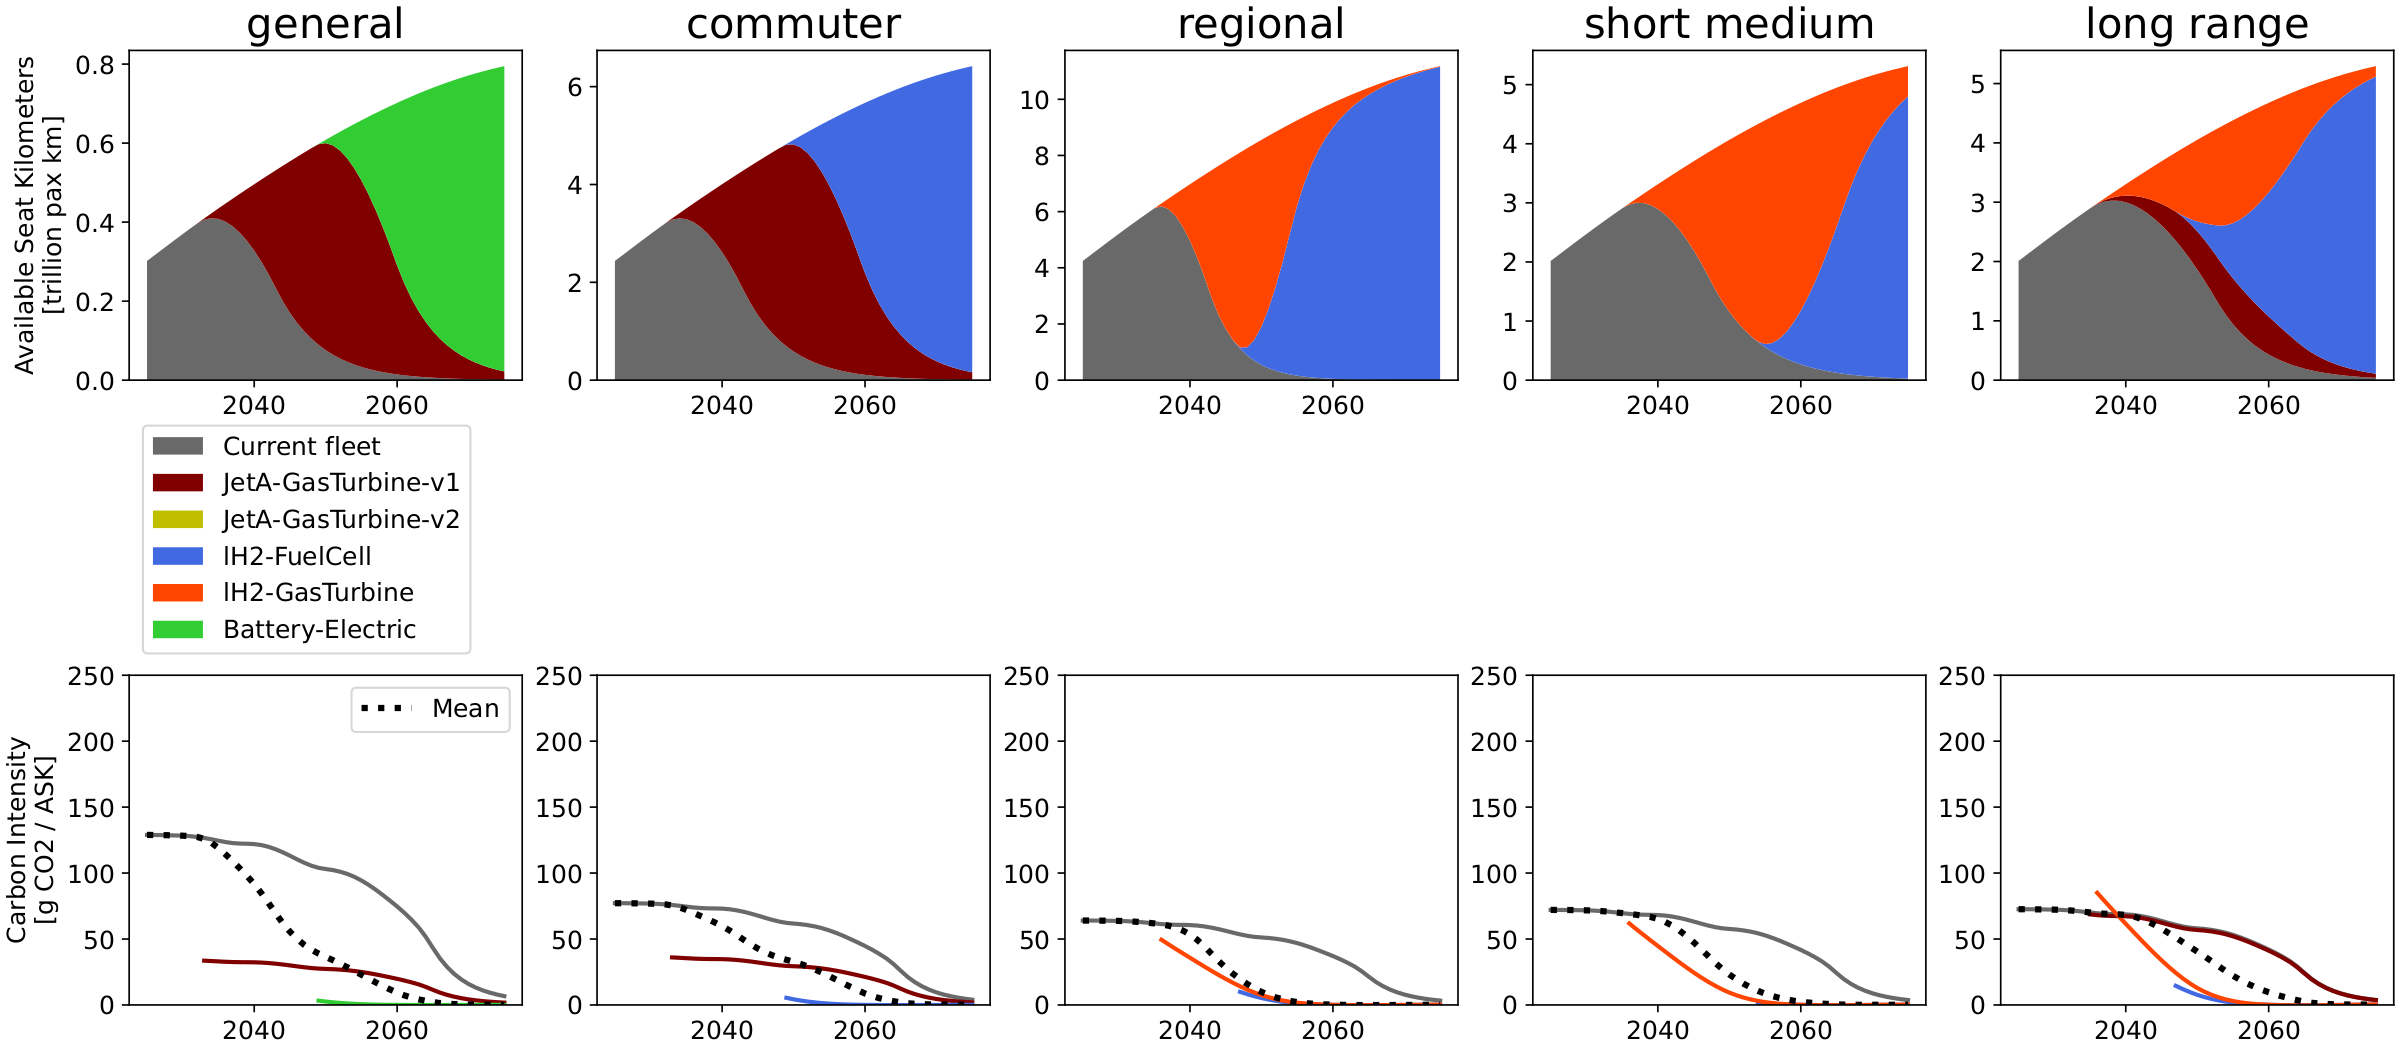
Fig. 28 Aircraft fleet composition per market: Breakthrough availability, Upper technology.#
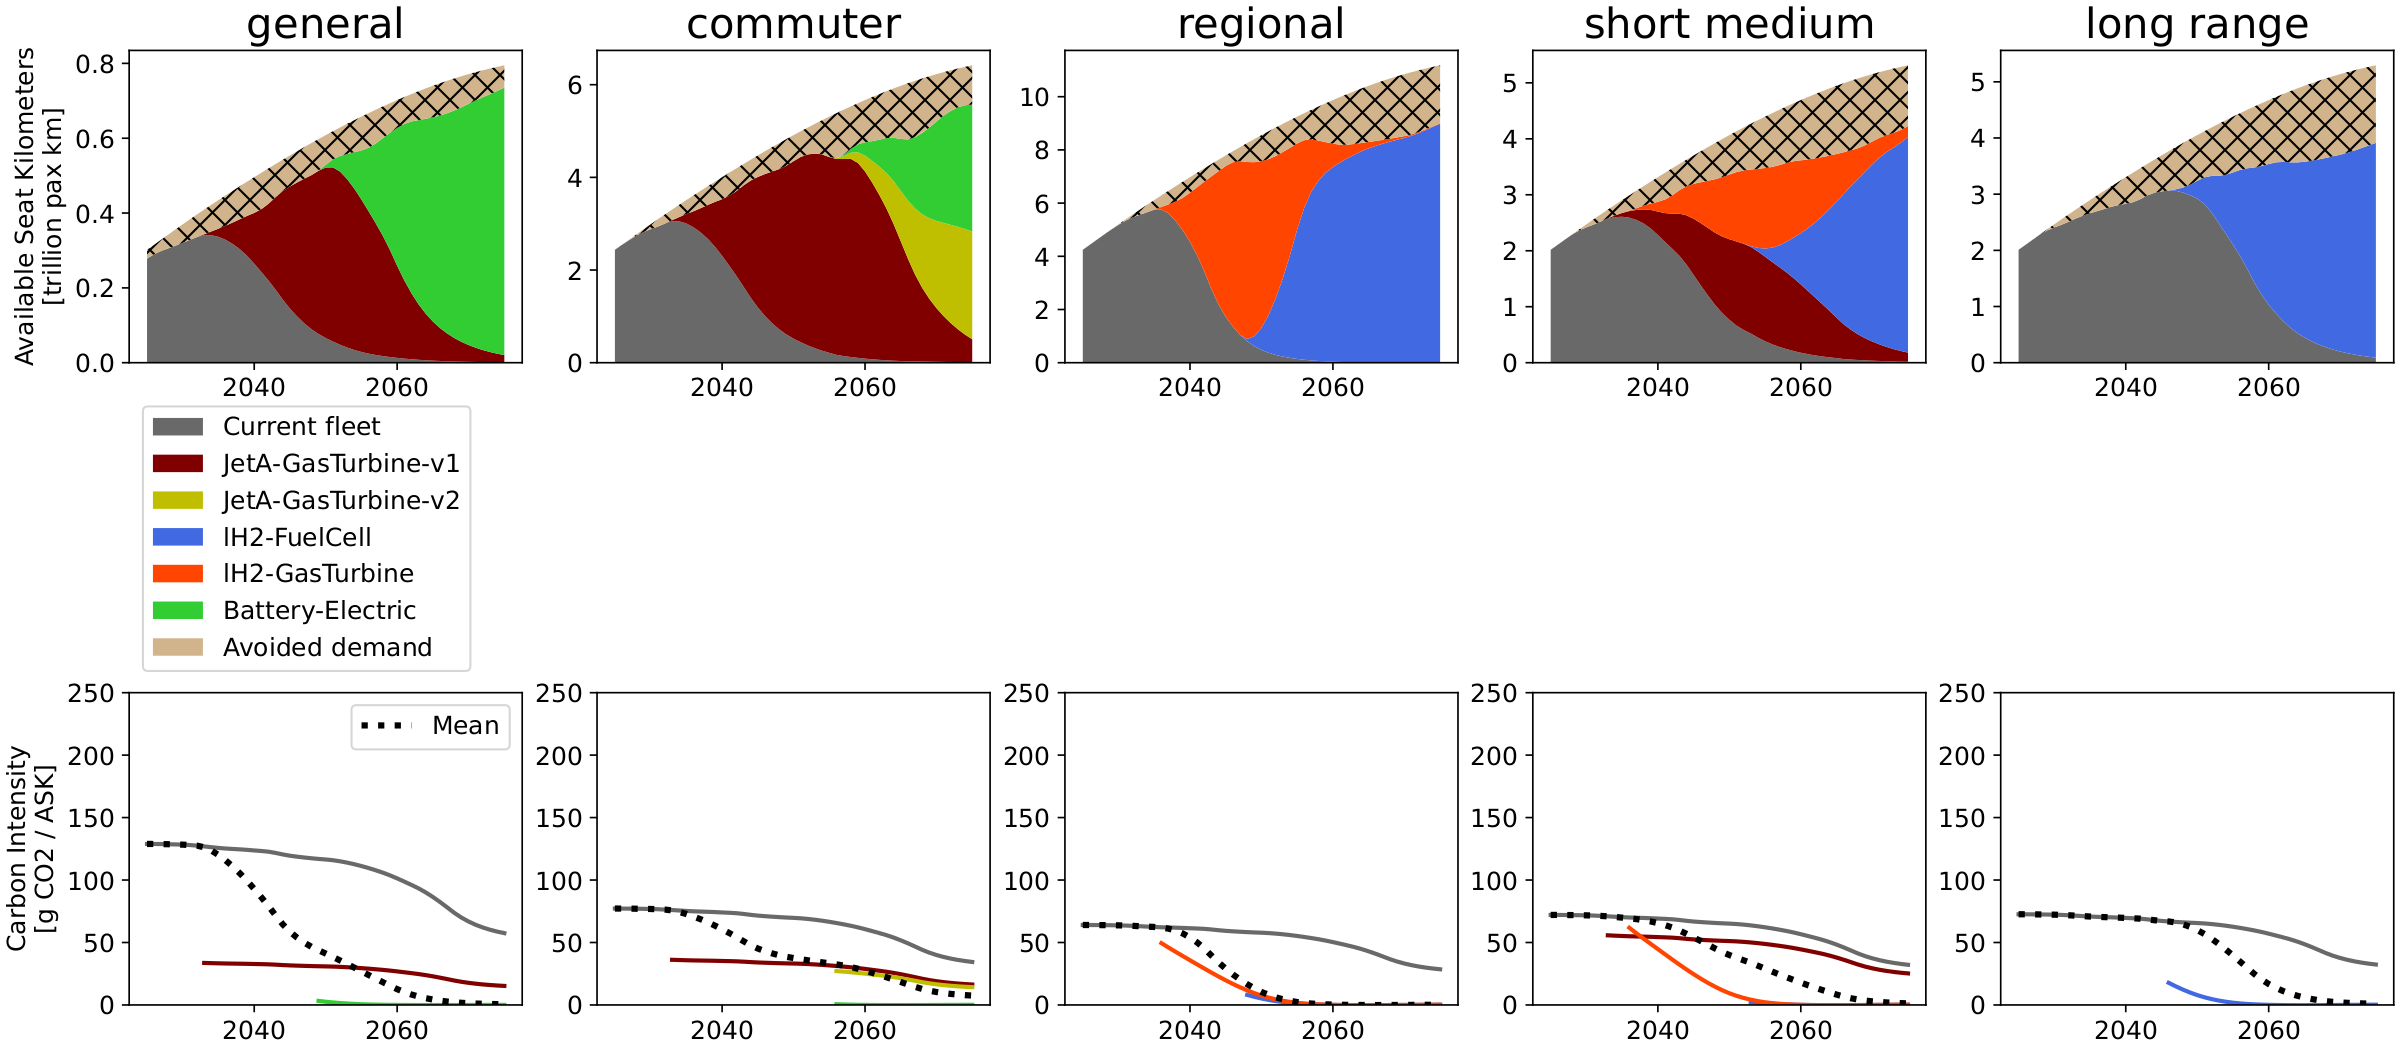
Fig. 29 Aircraft fleet composition per market: Breakthrough low-demand, Upper technology. Assumptions on energy availability and aircraft technology significantly impacts the performance of new aircraft designs, driving the choice of which architectures to deploy and when they are launched.#
Full results: Drop-in#
The complete energy-mix results for the Drop-in scenarios (supplementary information of the published article):
Drop-in trend
Drop-in availability
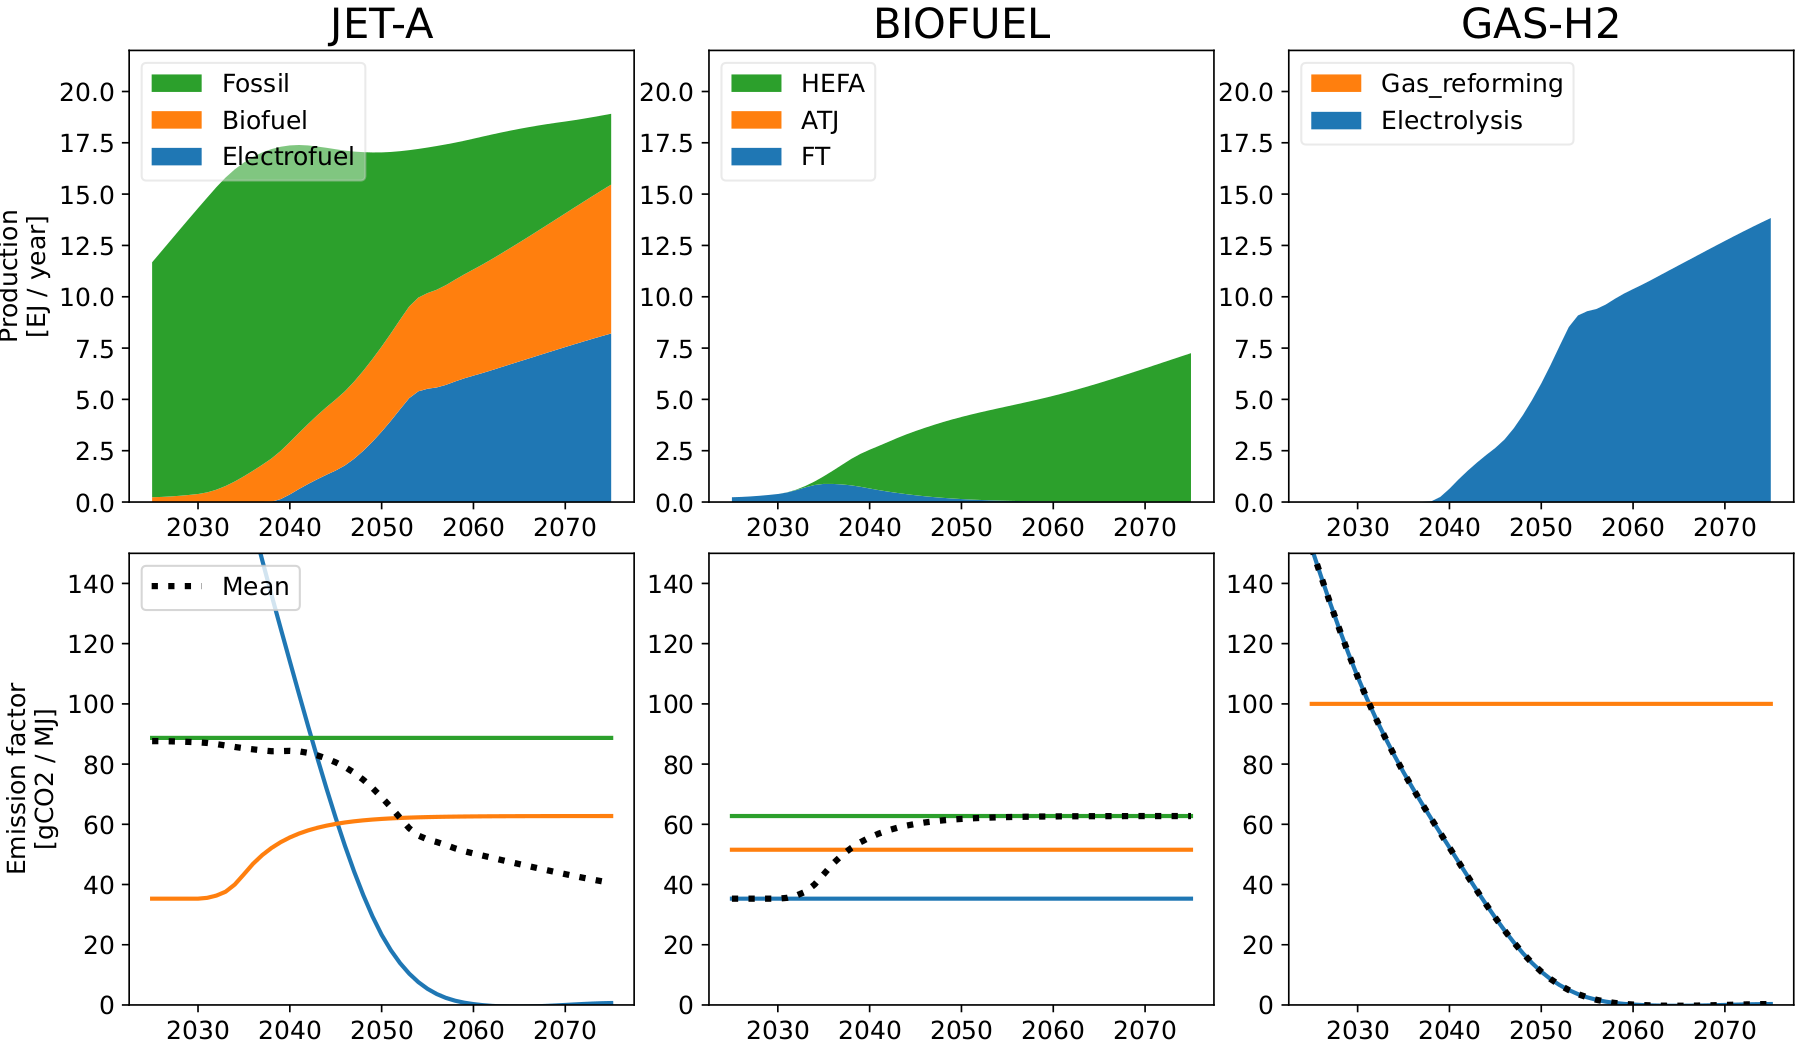
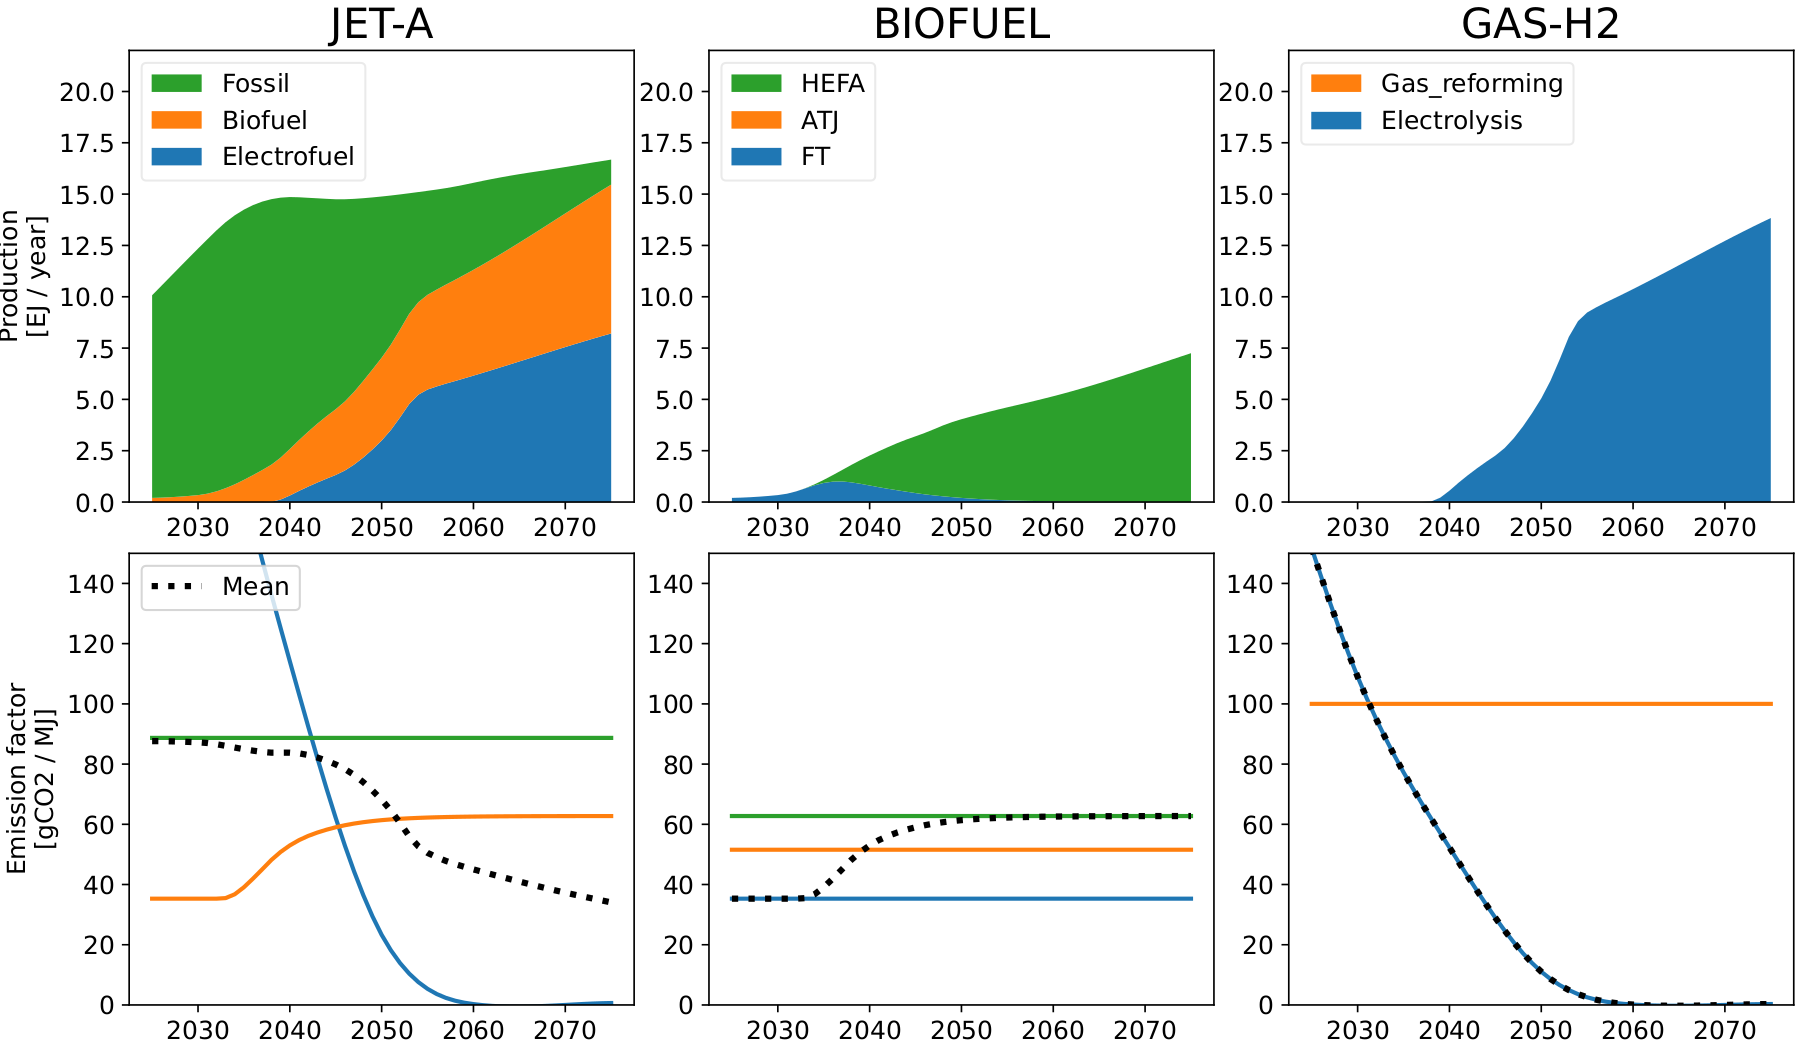
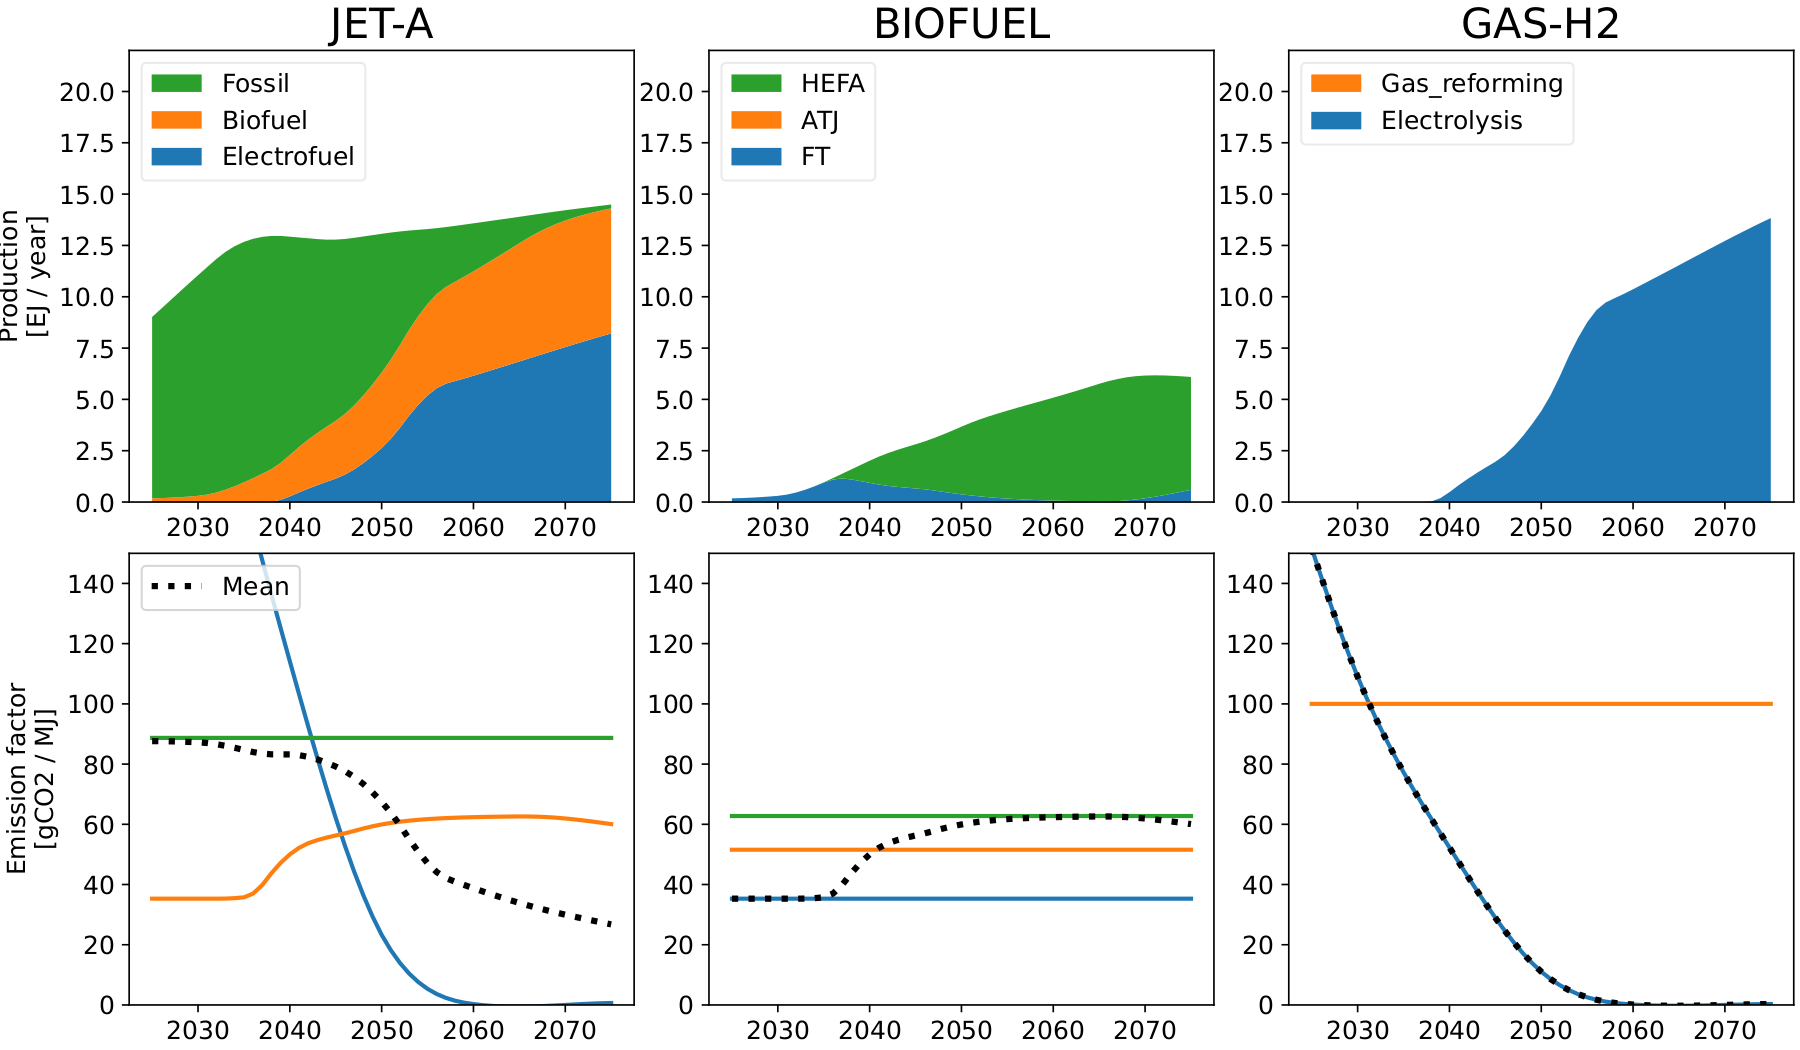
Drop-in low-demand (Mid technology)
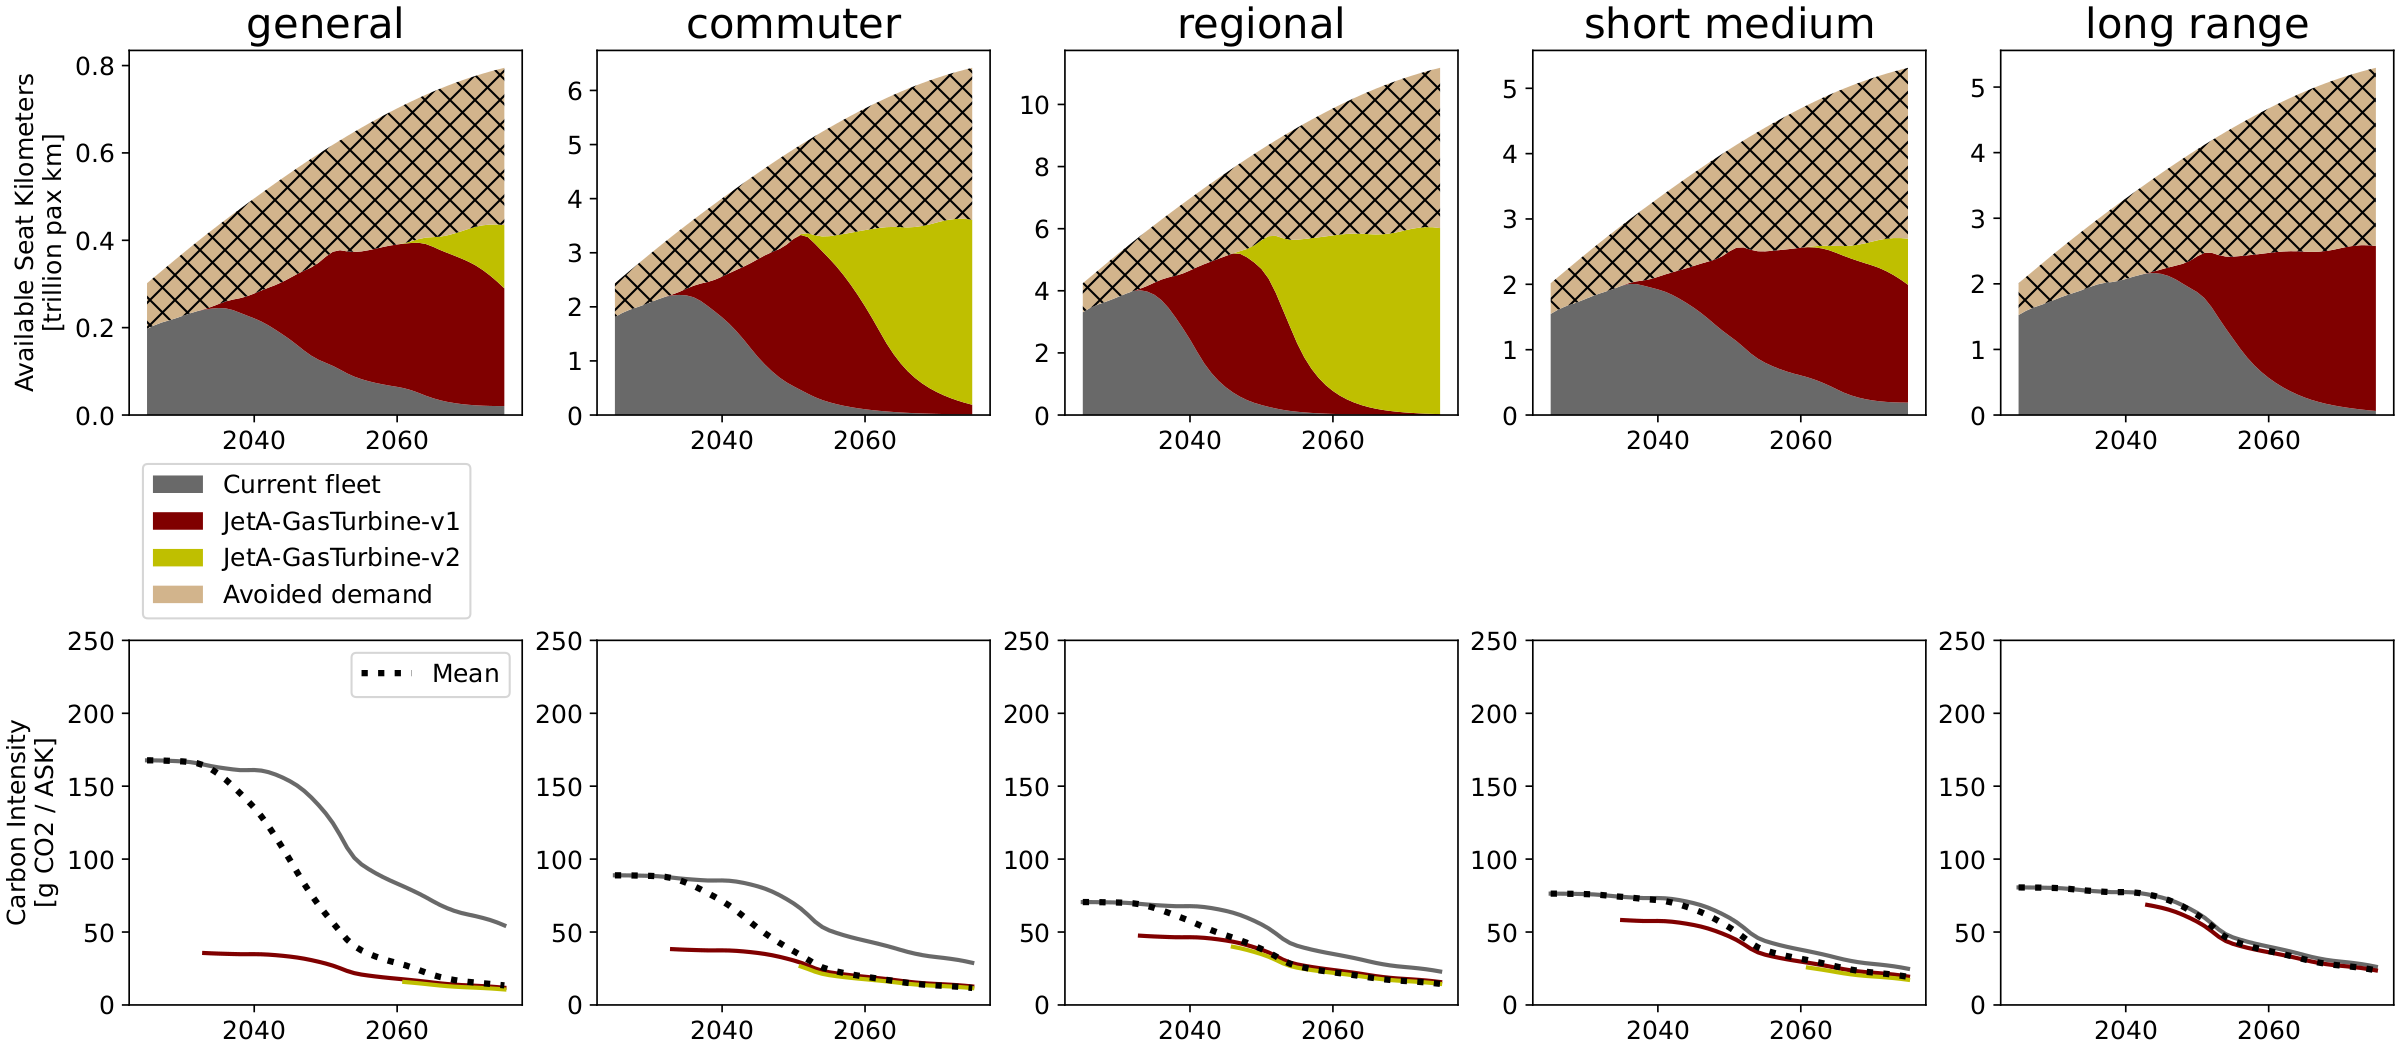
The Drop-in optimizations and comparison figures are produced by these scripts:

Drop-in reference: SSP2-2.6 baseline (fossil kerosene only)



Full results: Breakthrough#
The complete fleet and energy-mix results for the Breakthrough scenarios:
Breakthrough trend
Breakthrough availability
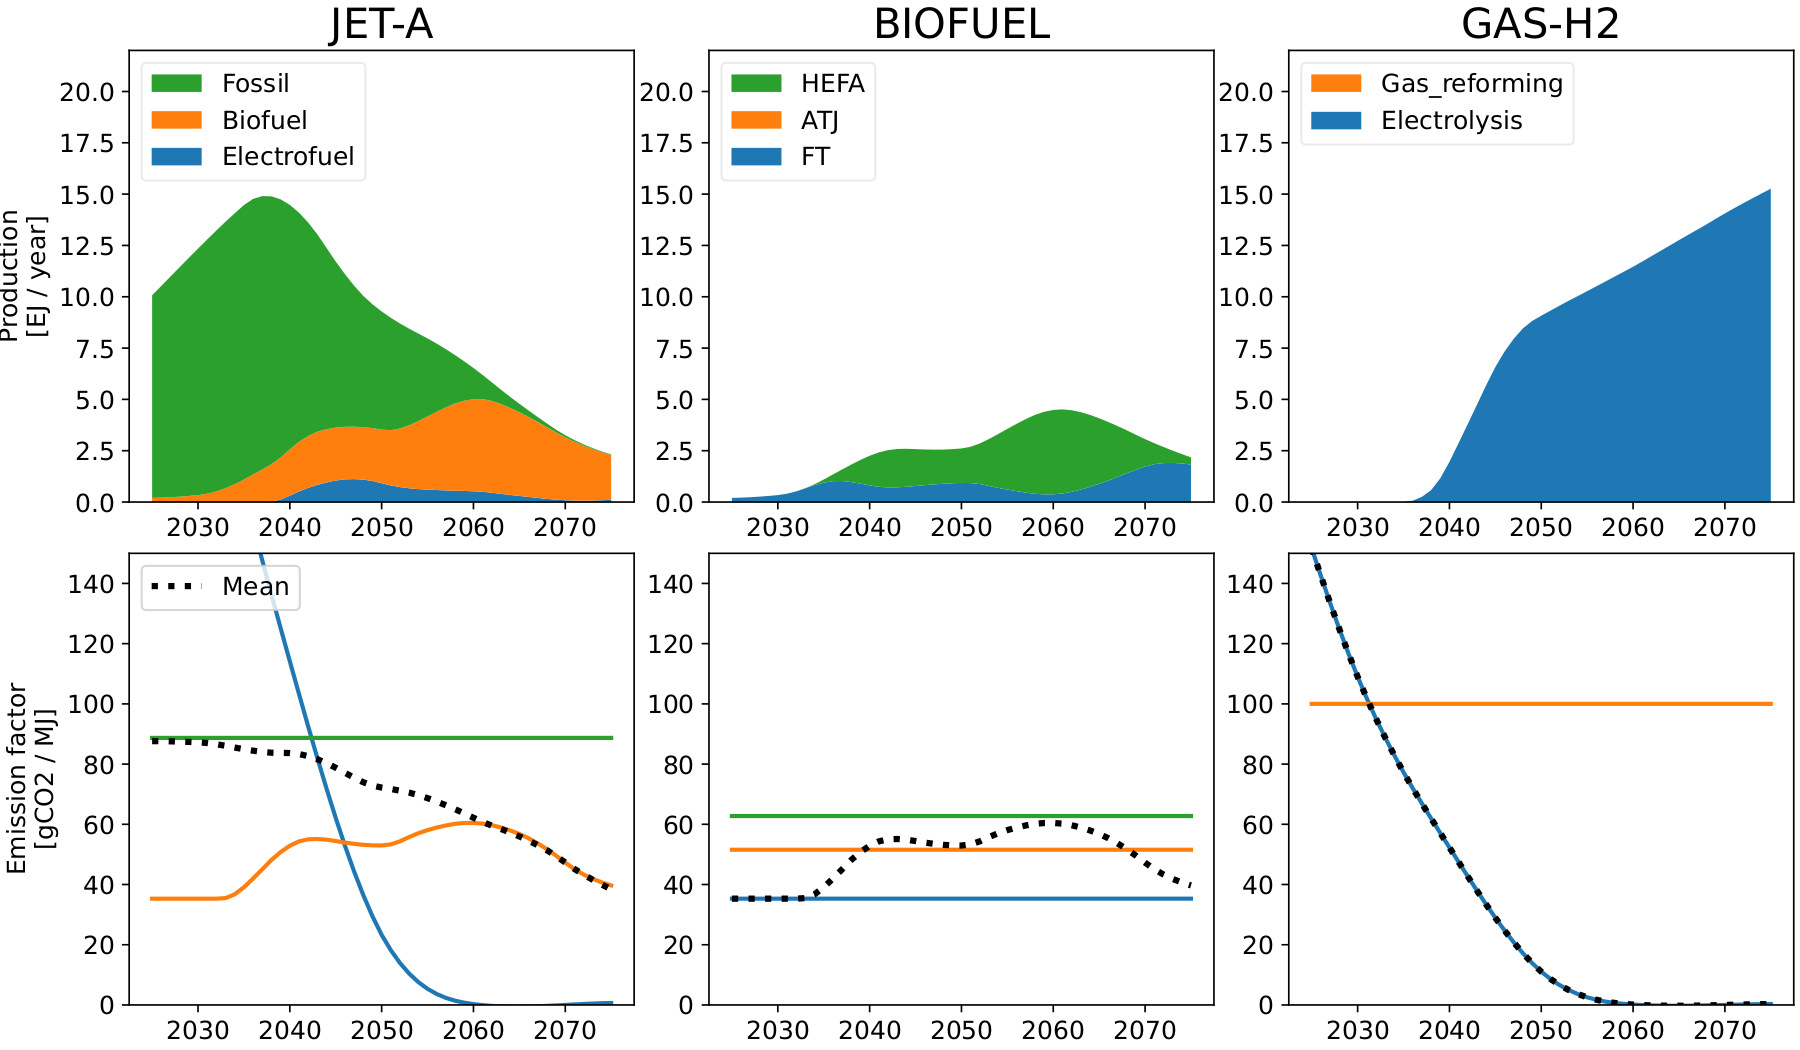
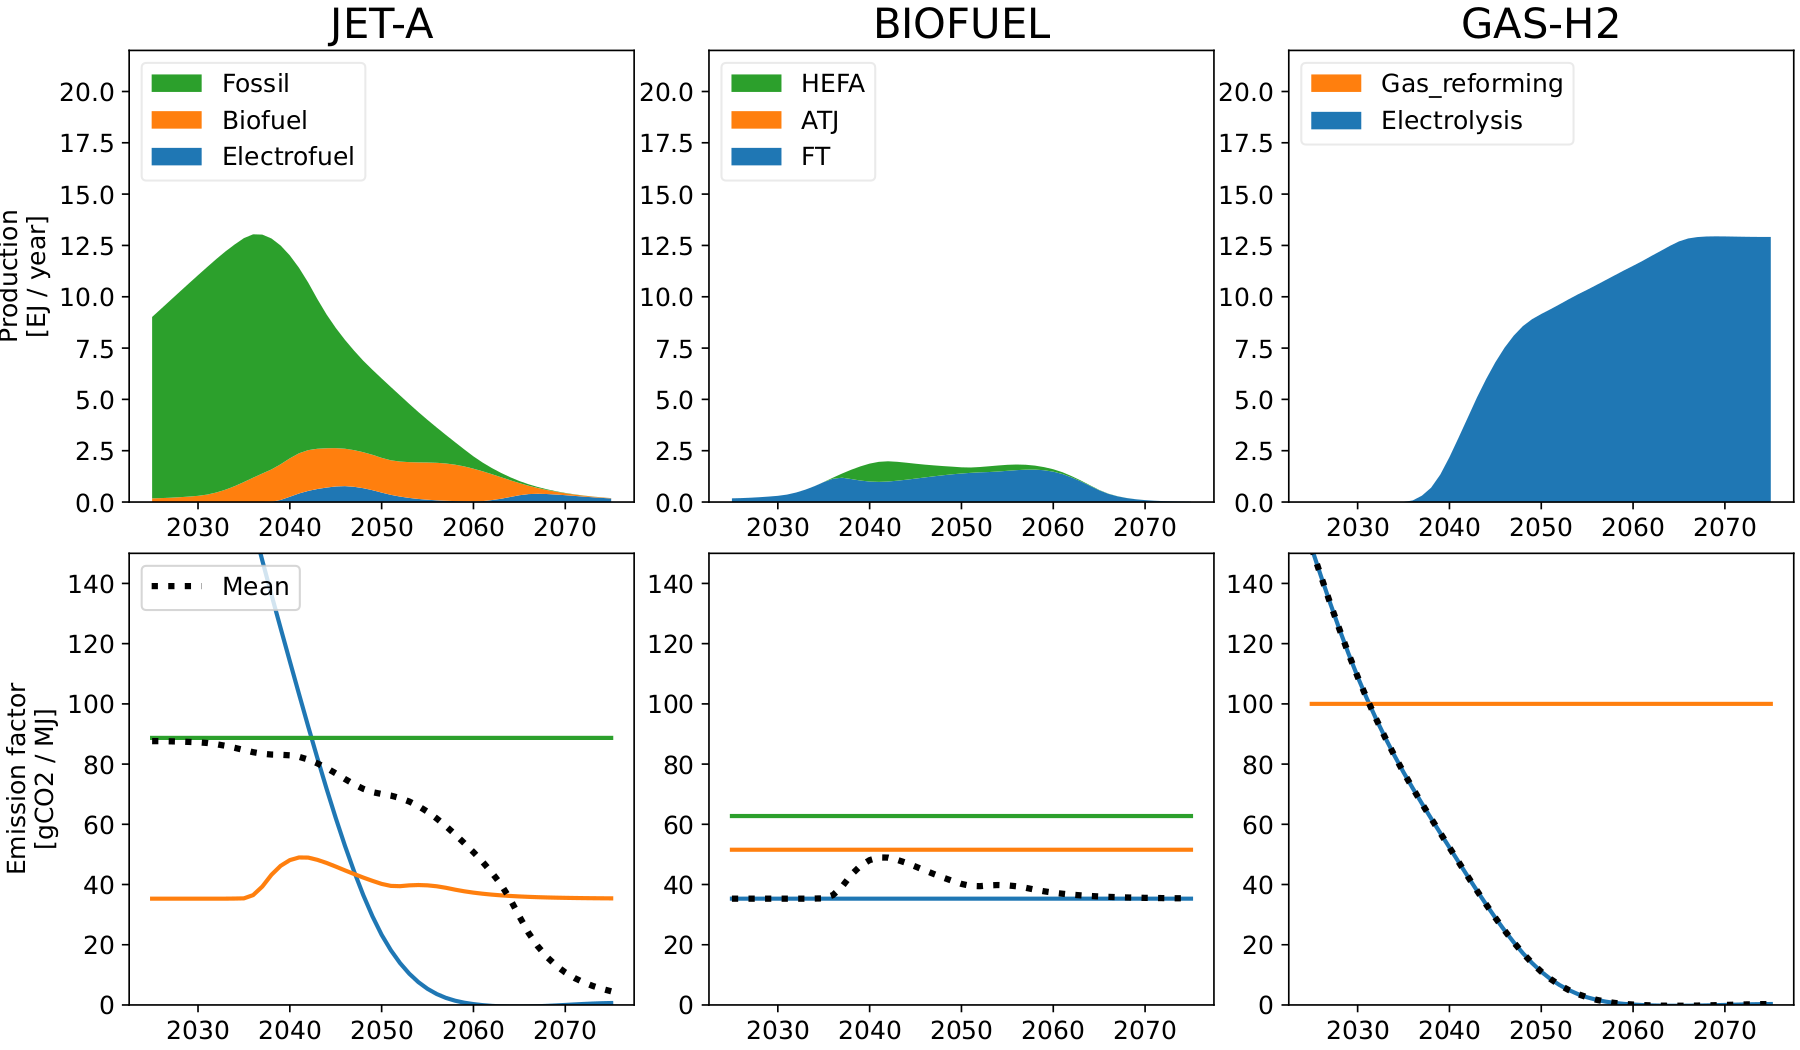
Breakthrough low-demand
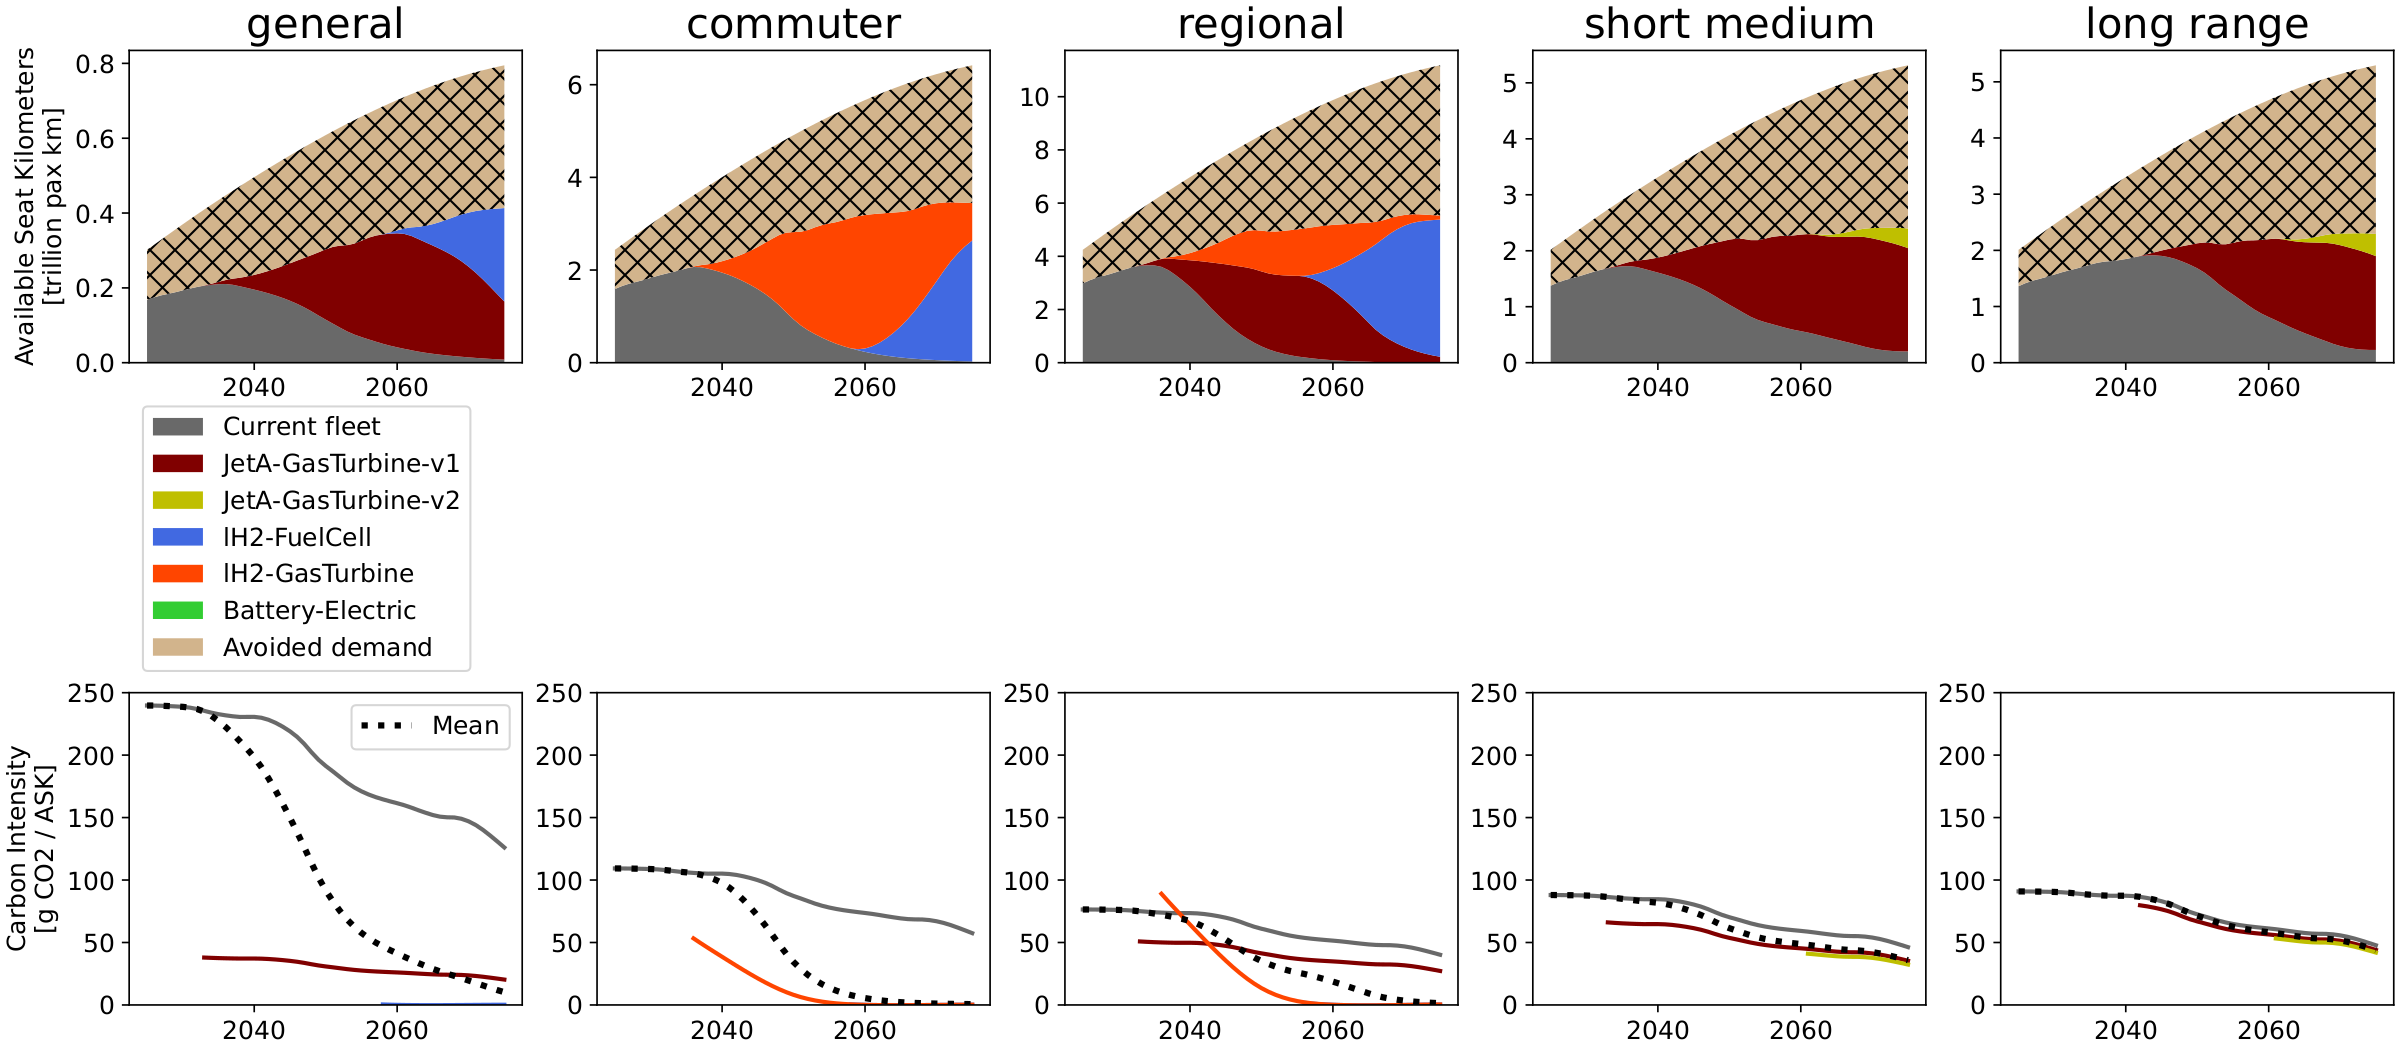
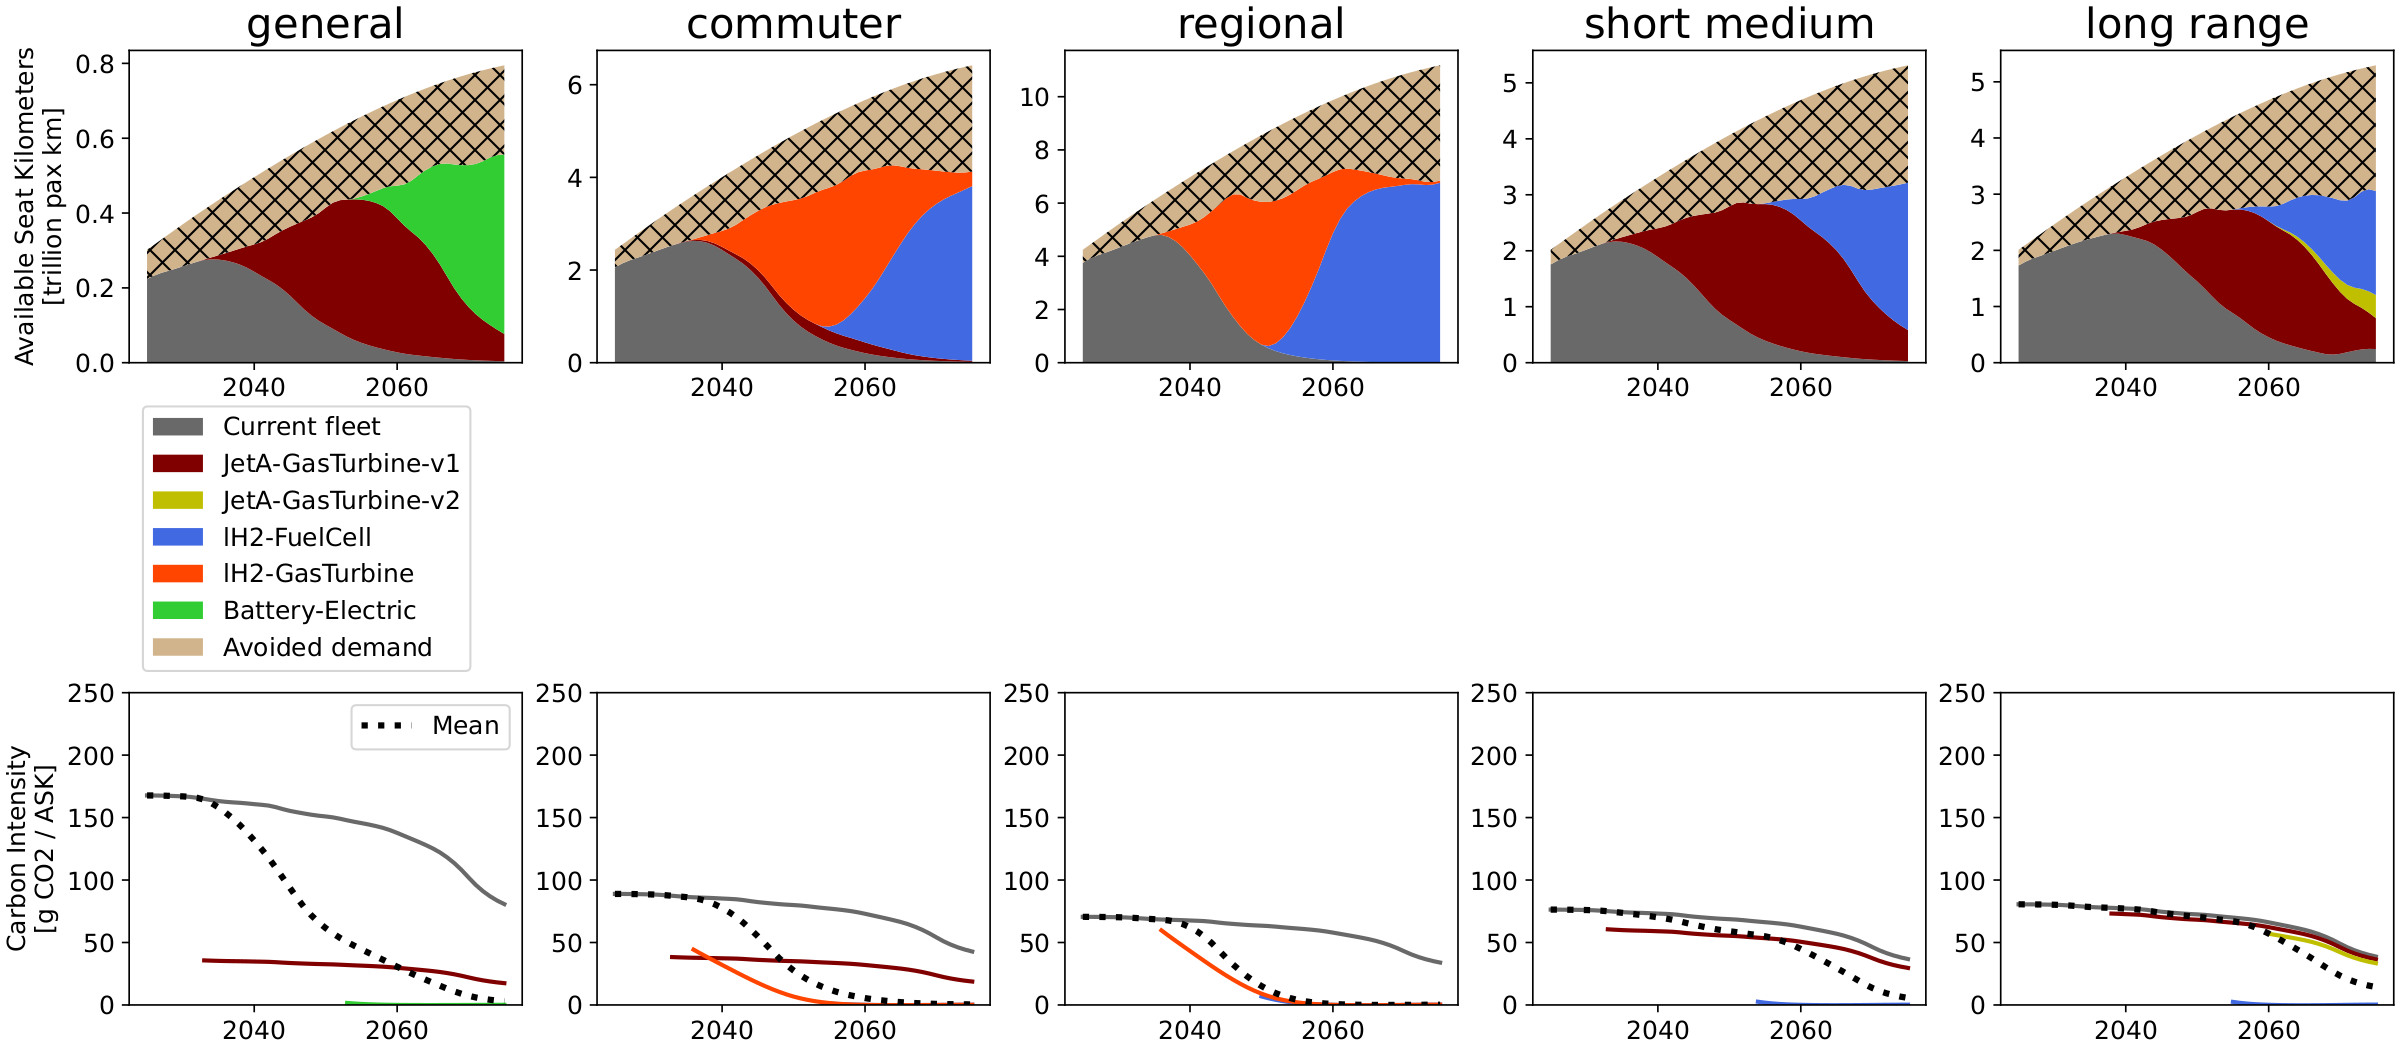
The Breakthrough optimizations and comparison figures are produced by these scripts:

Breakthrough reference: SSP2-2.6 baseline (fossil kerosene only)

Breakthrough aircraft: preferential energy allocation