
Scenario-robust mitigation policy#
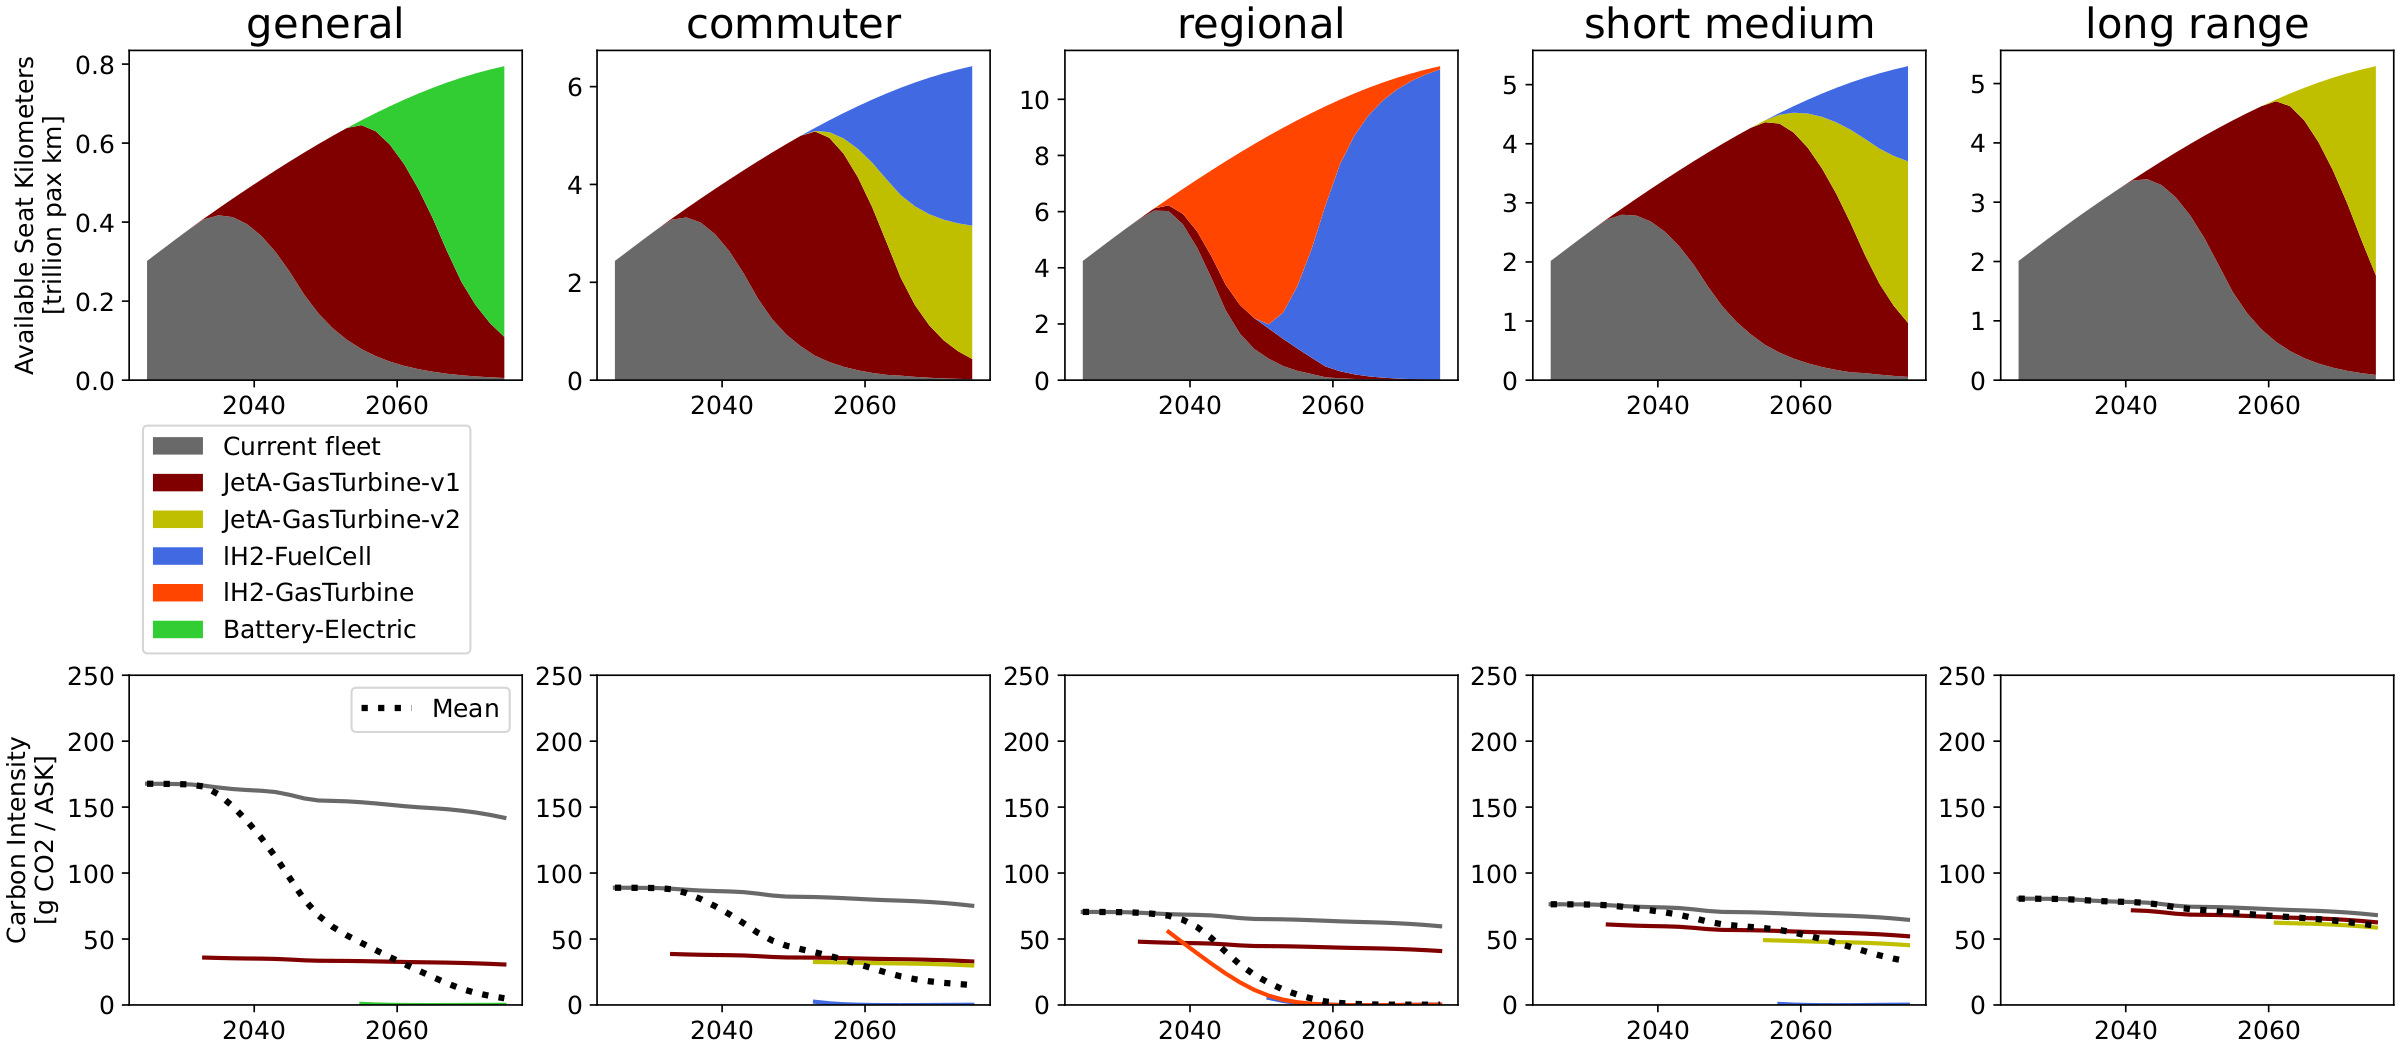
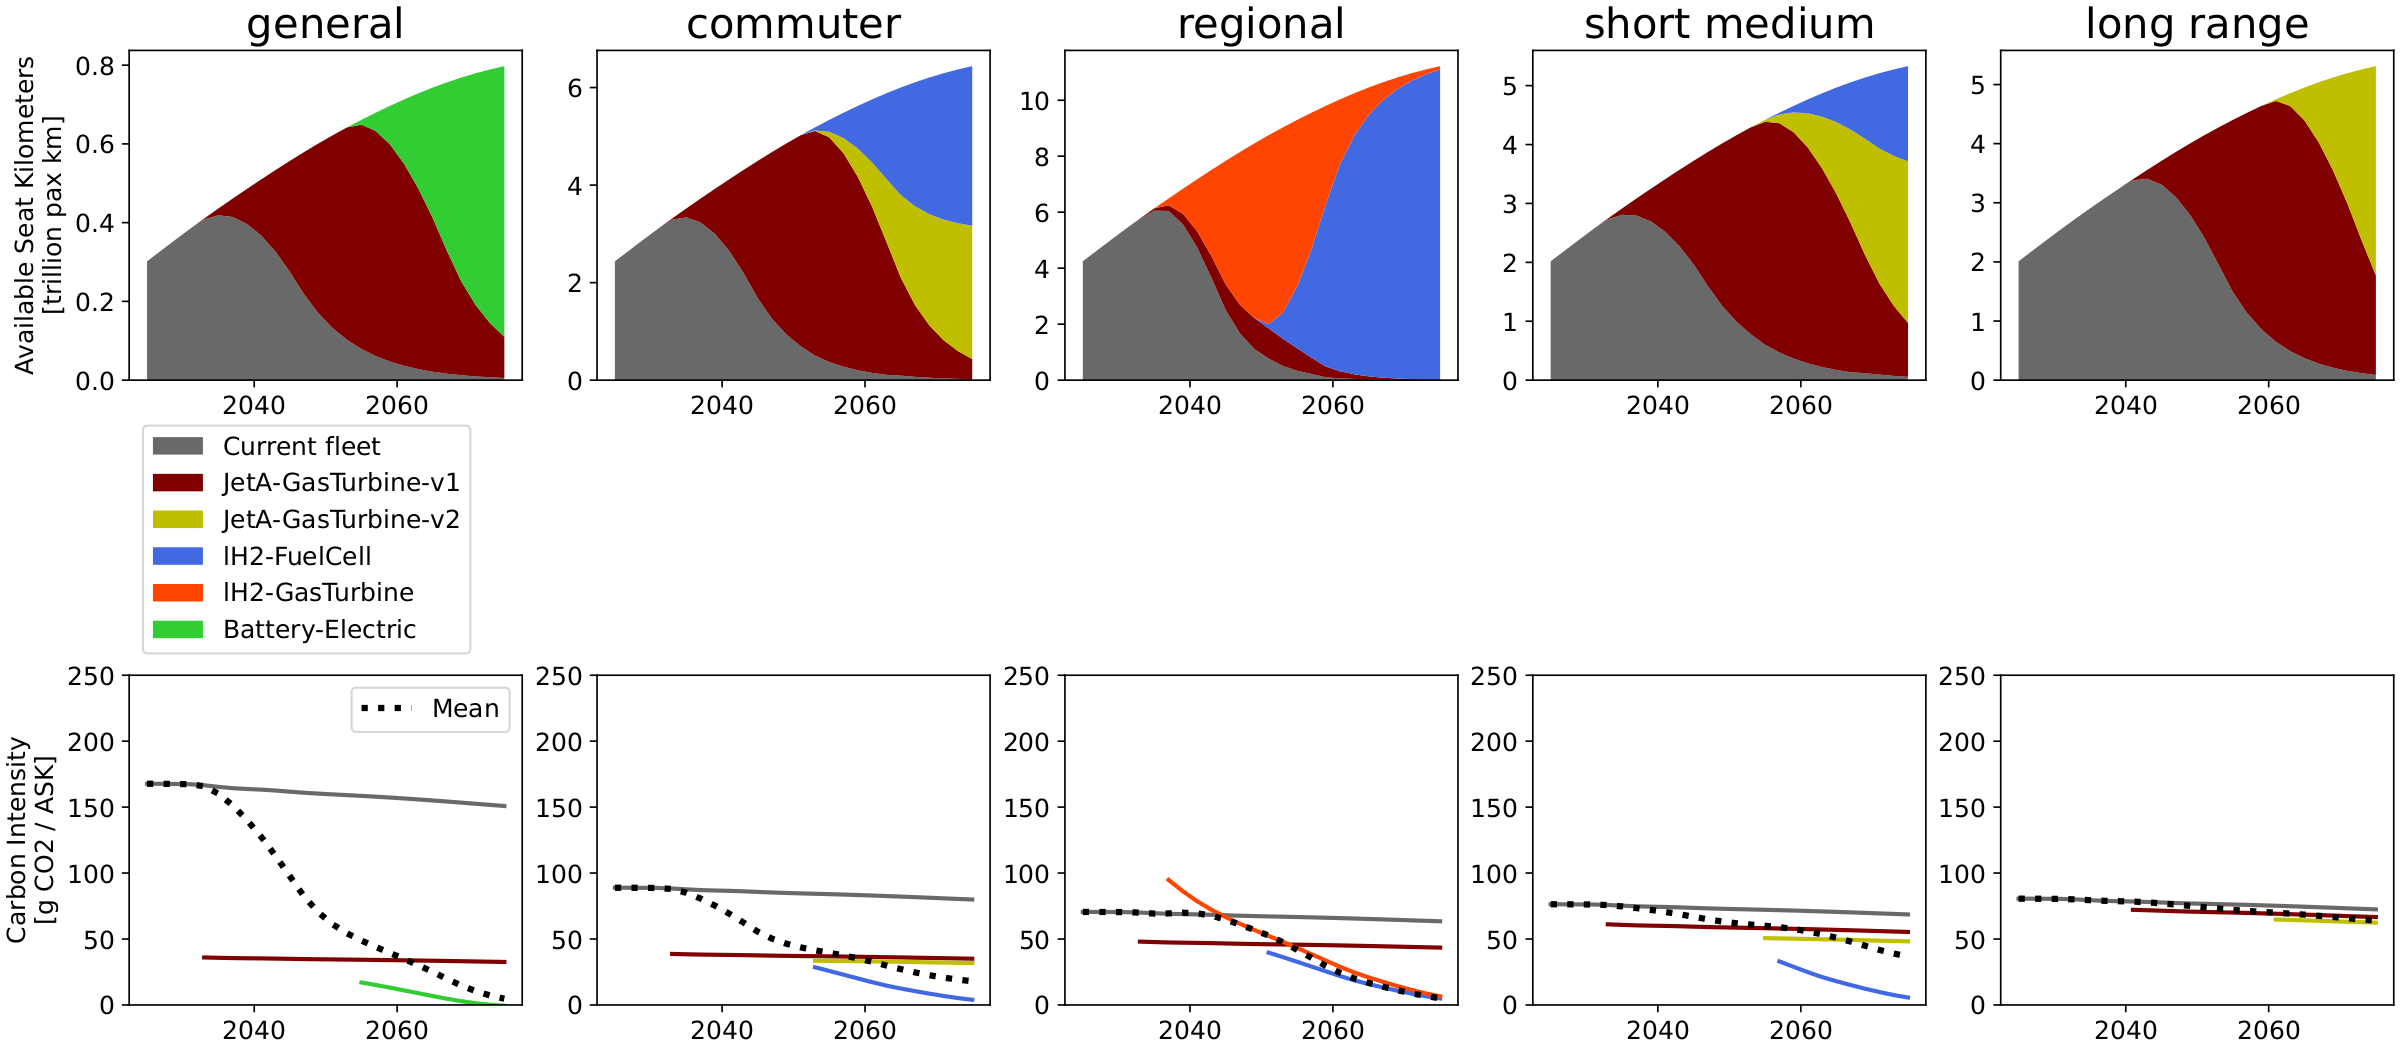
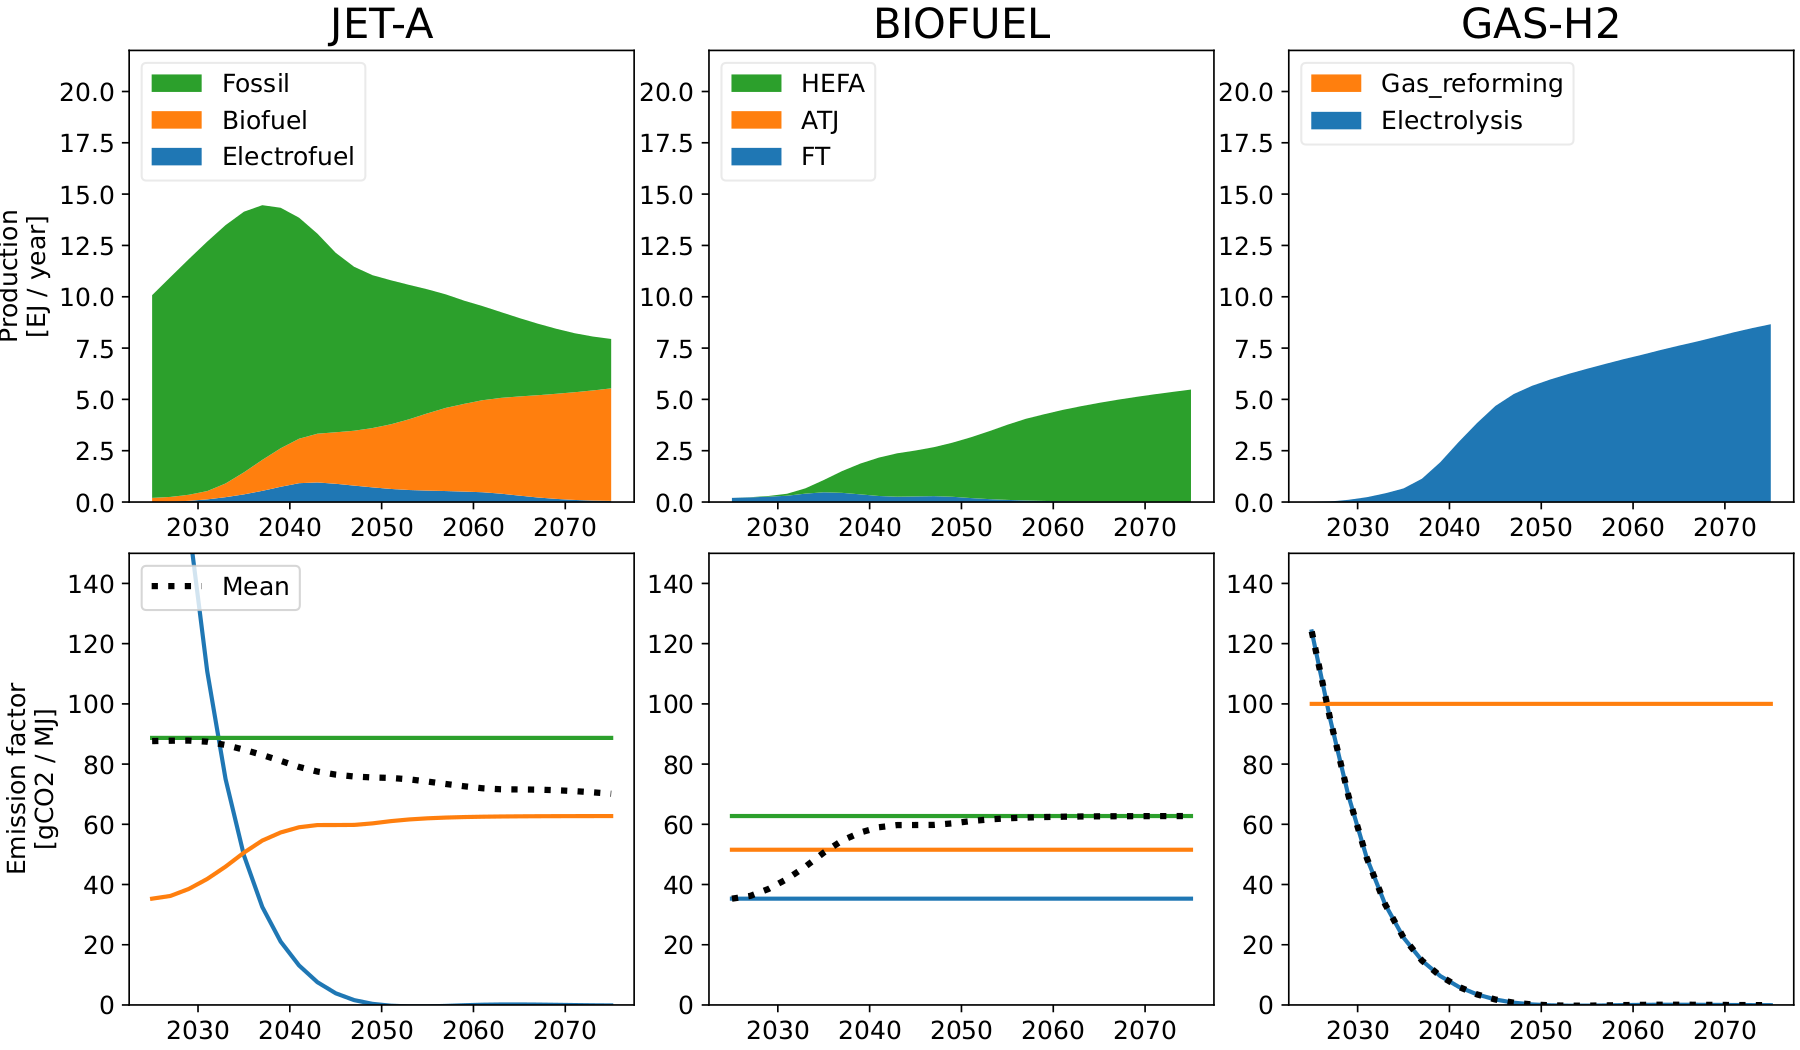
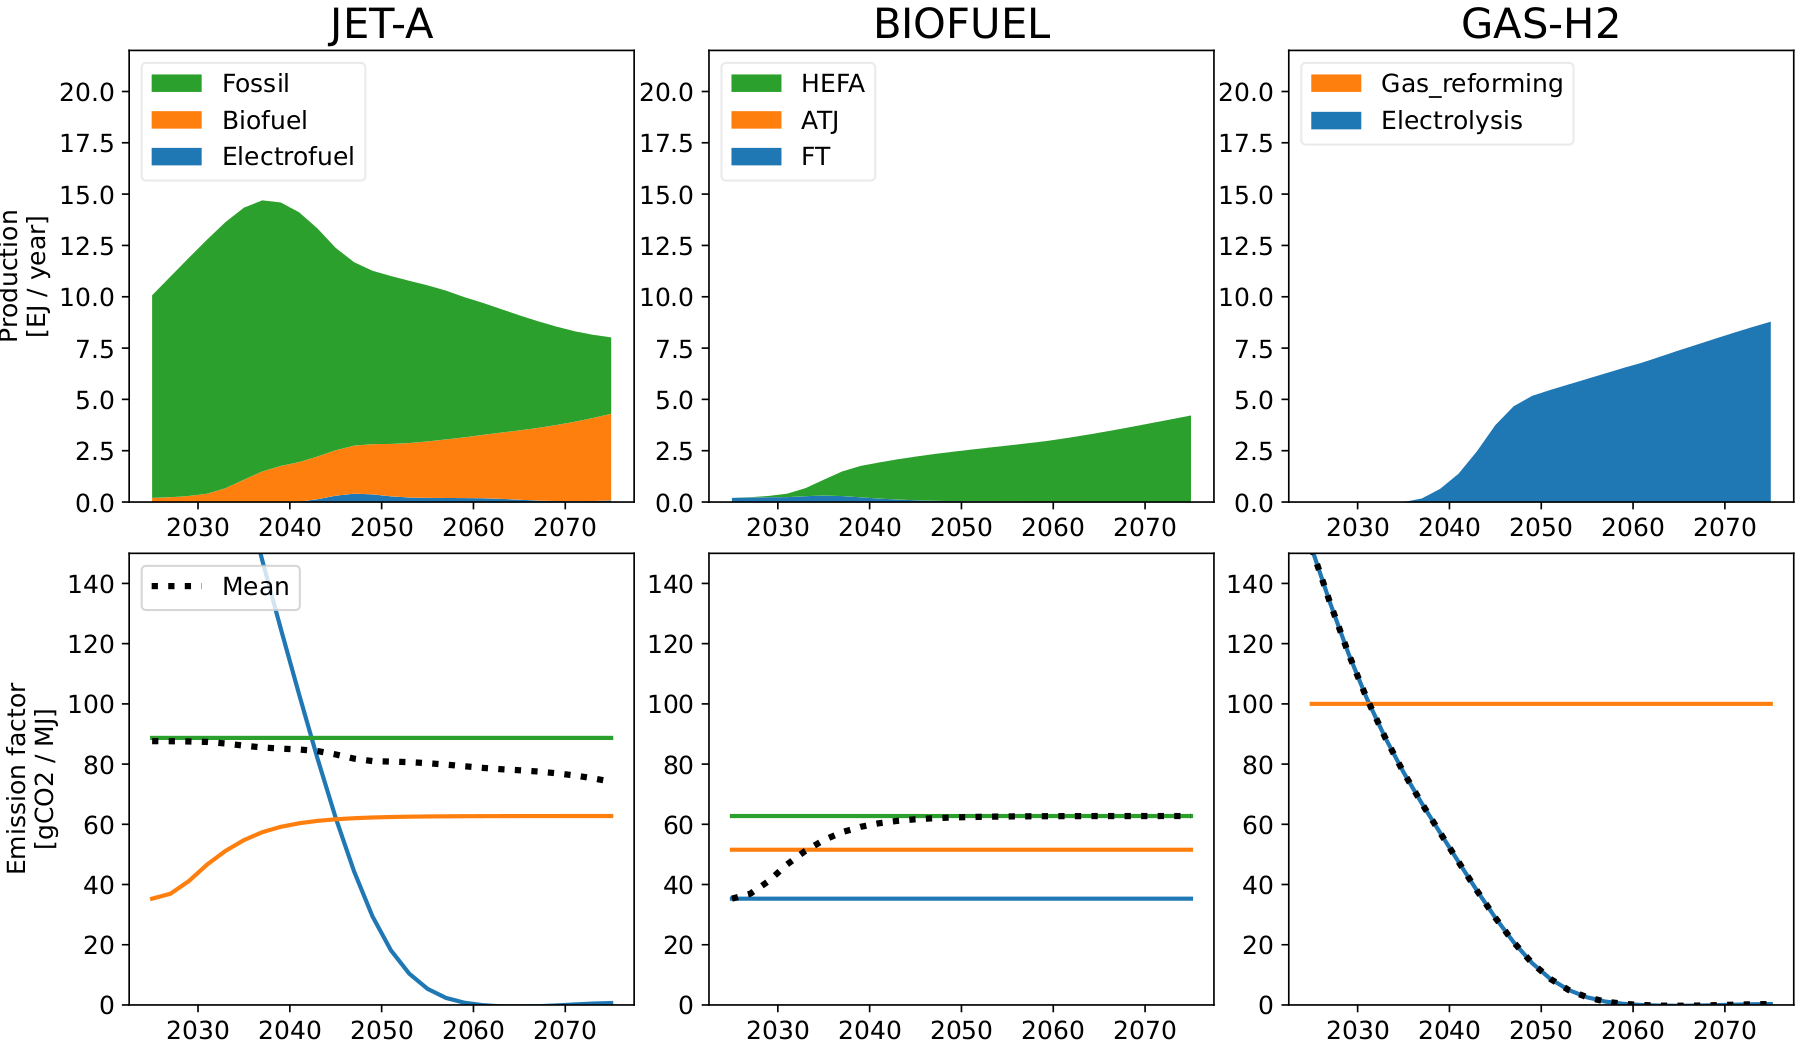
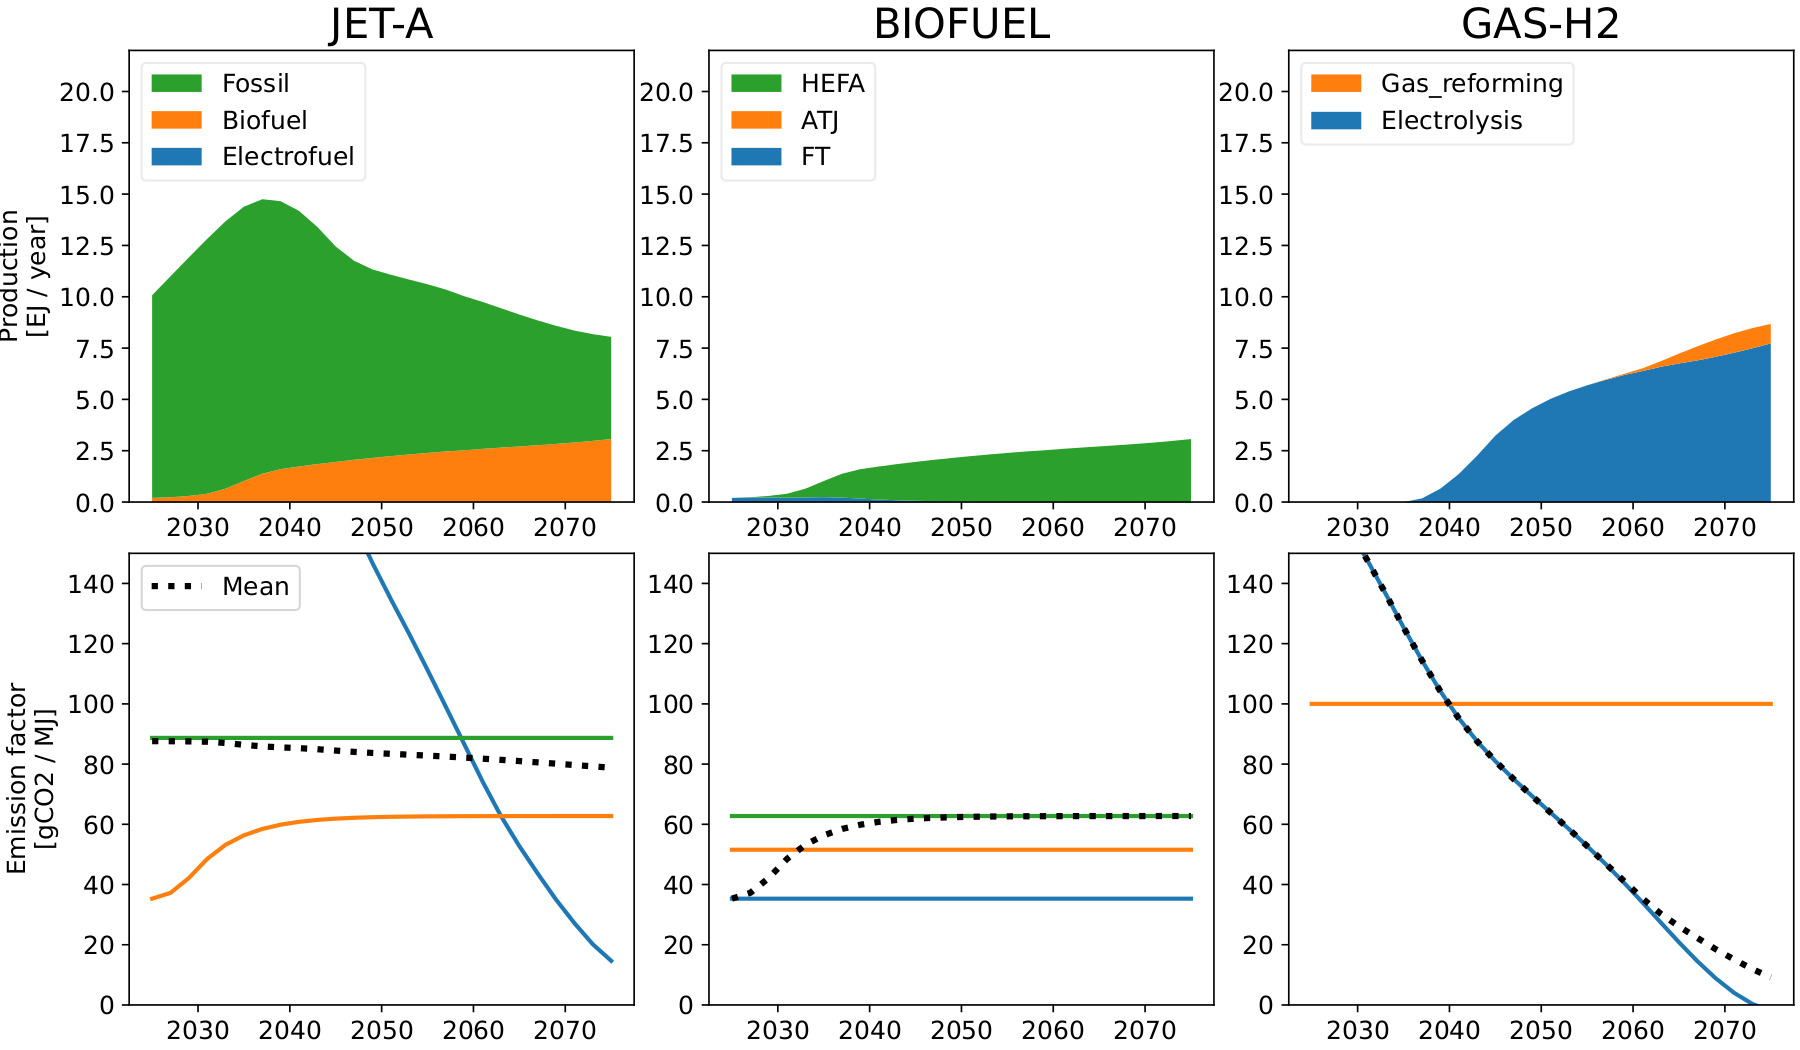
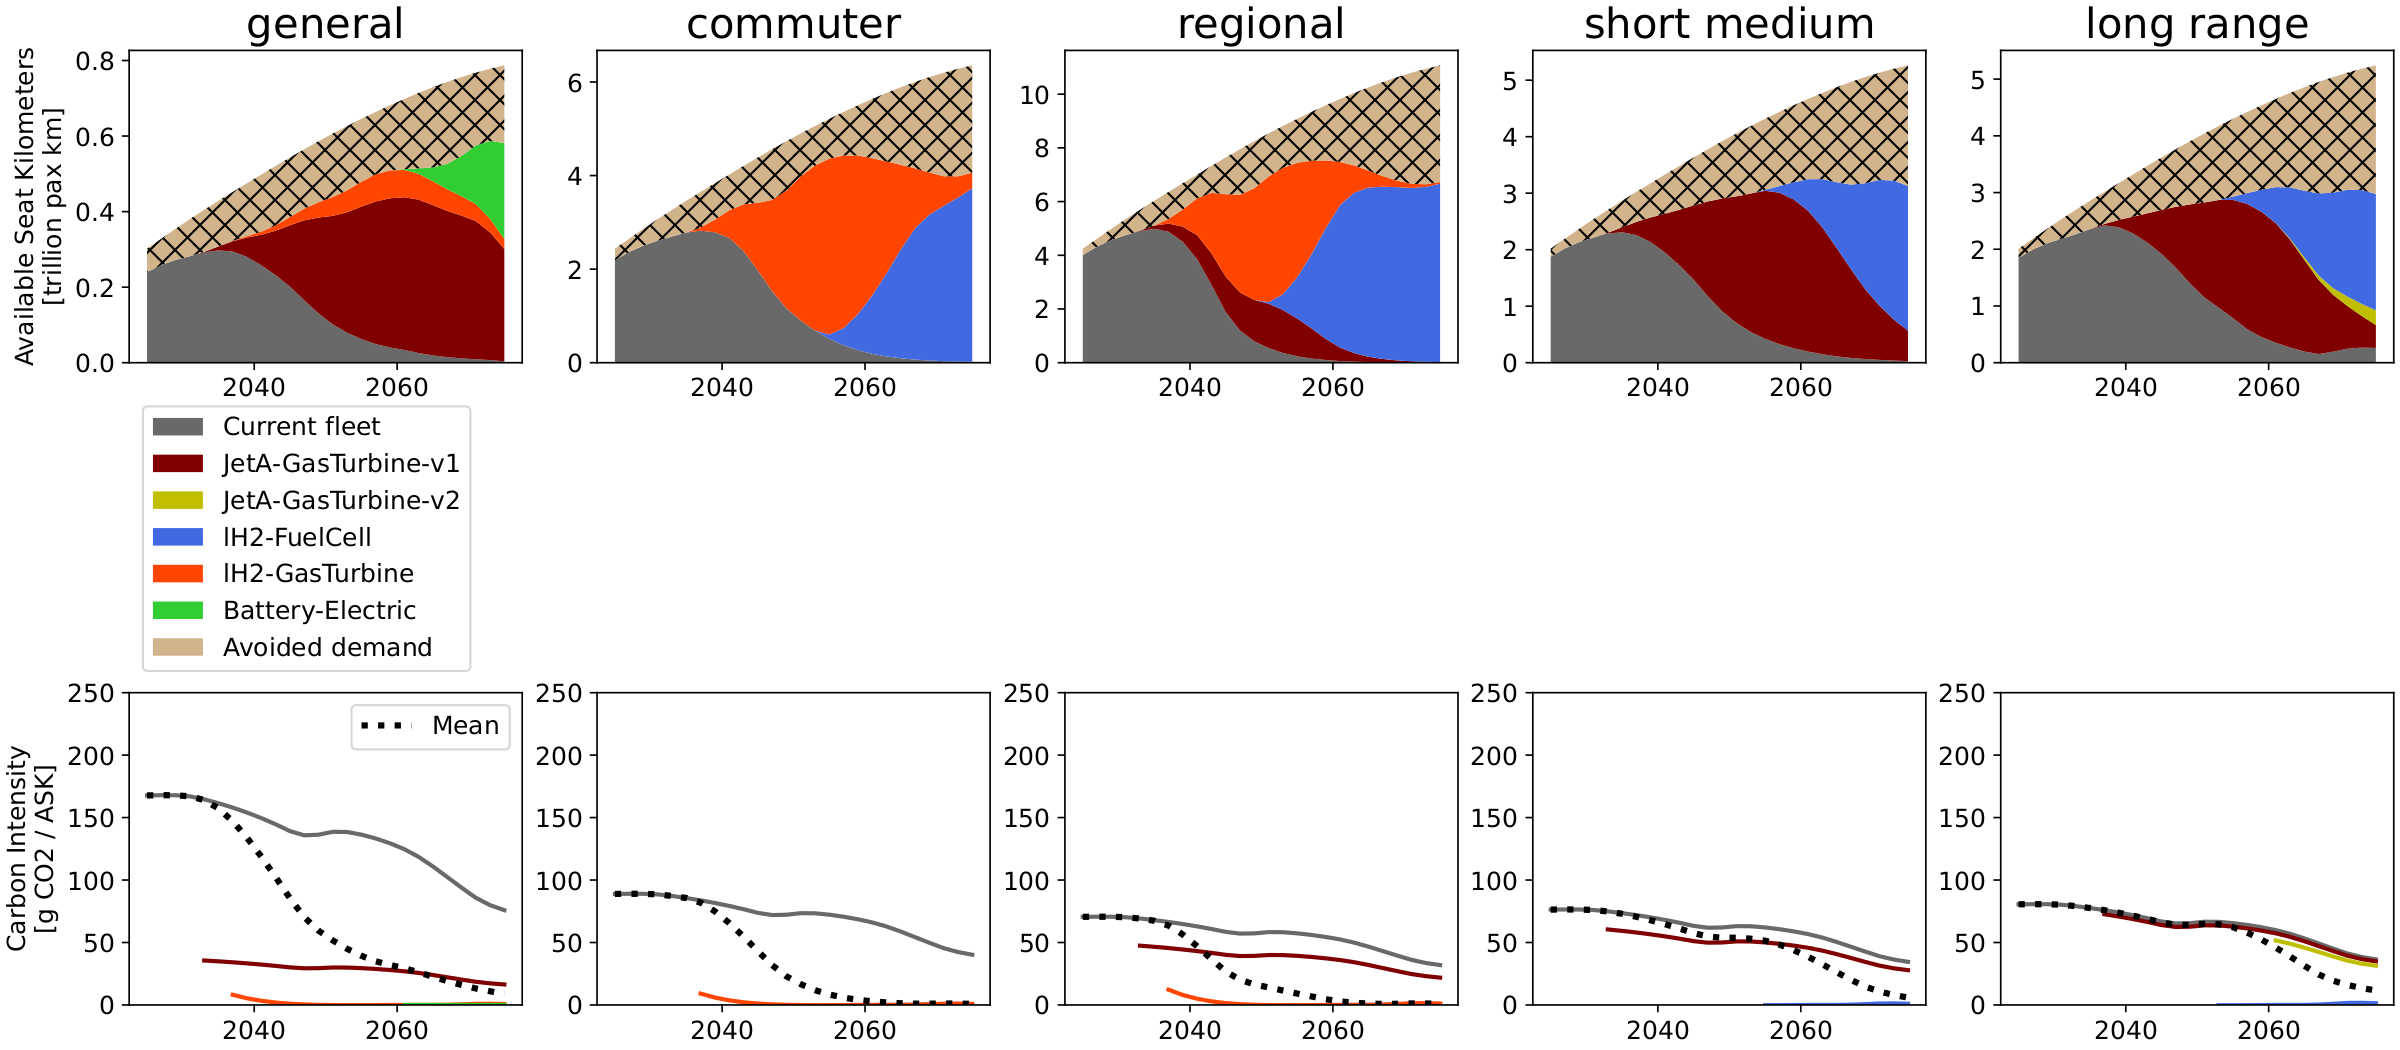
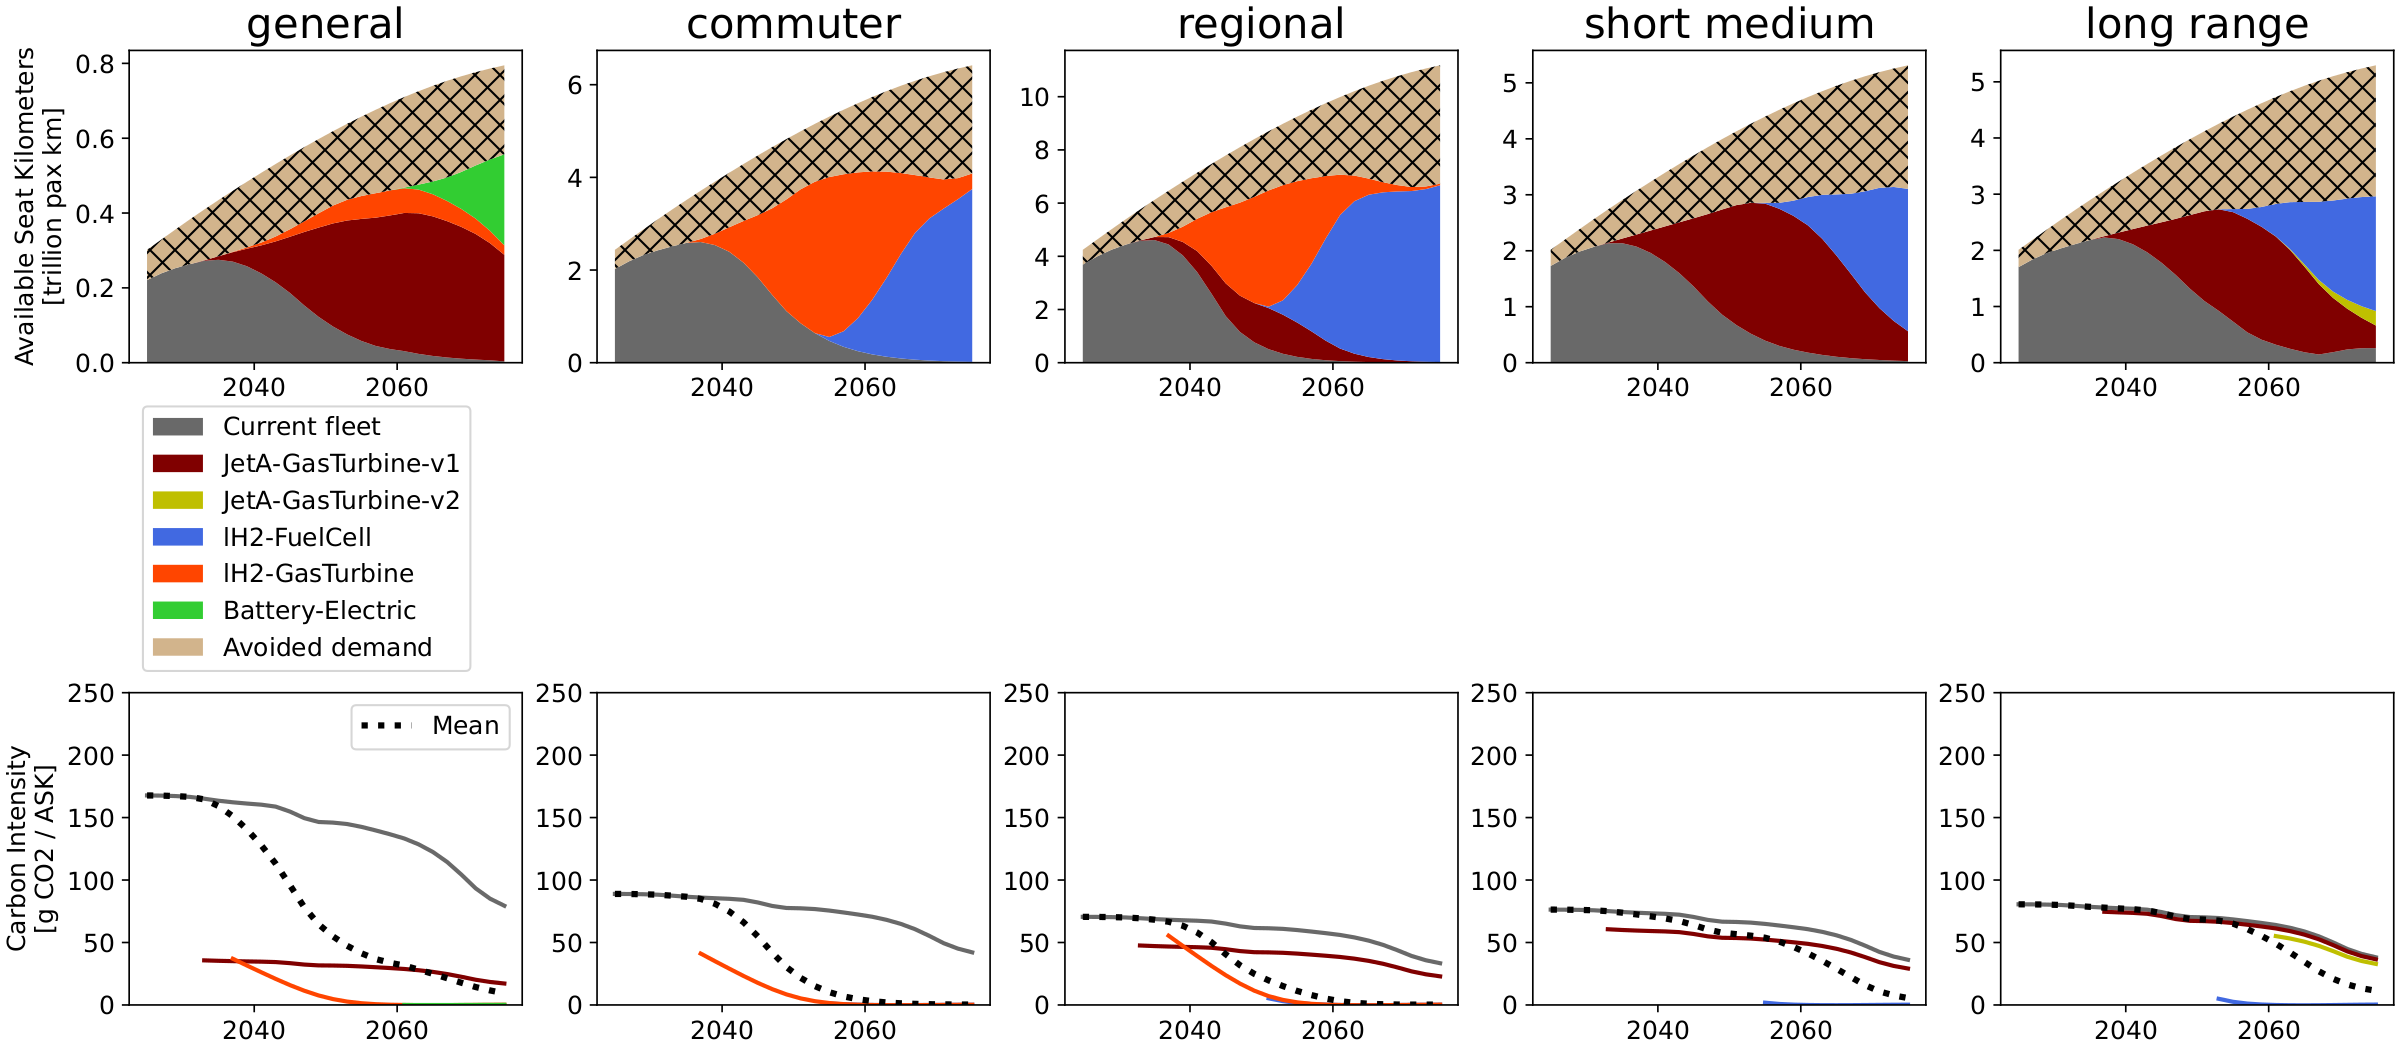
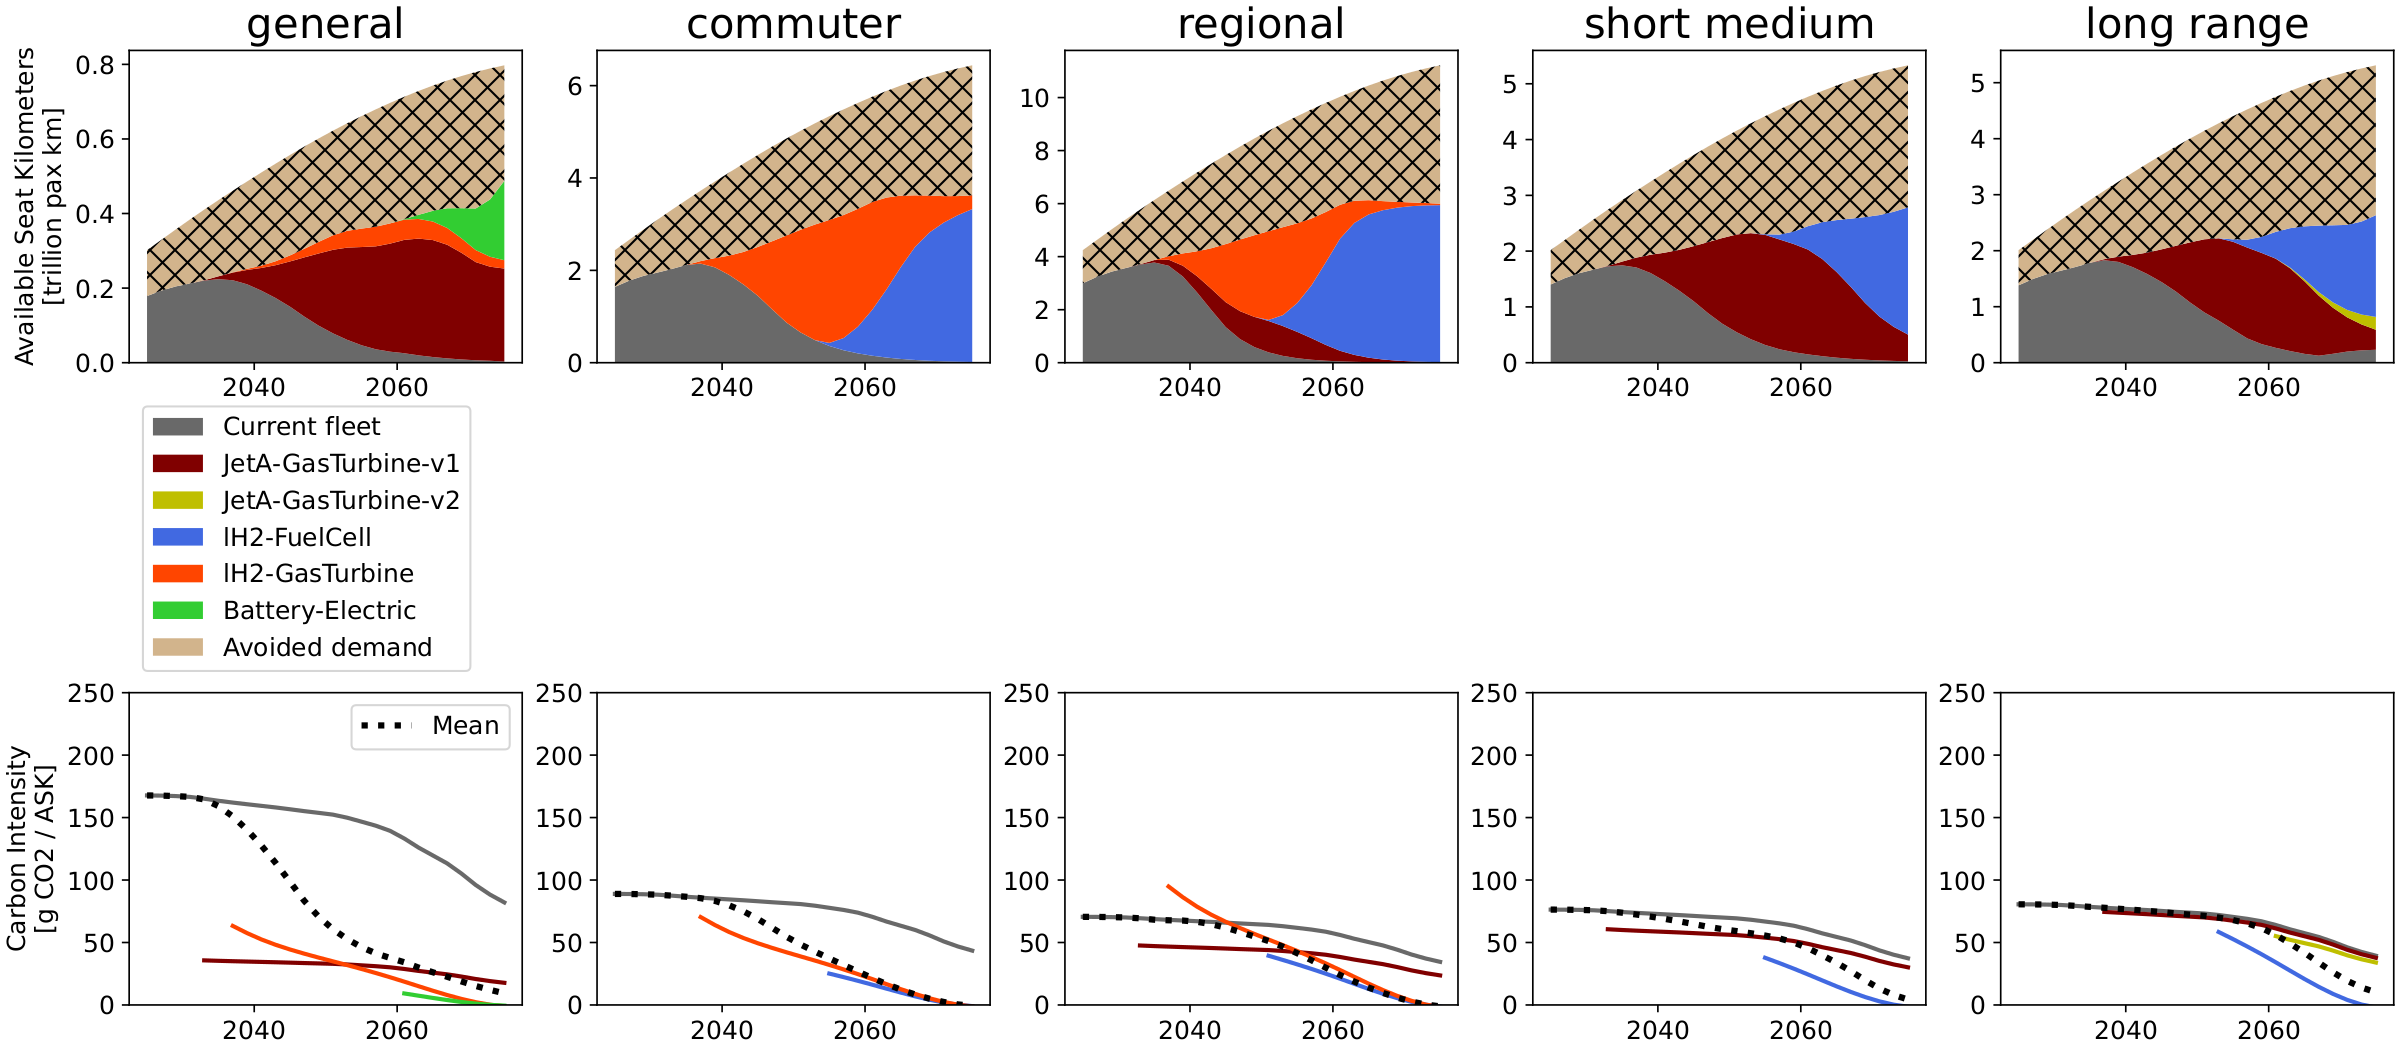
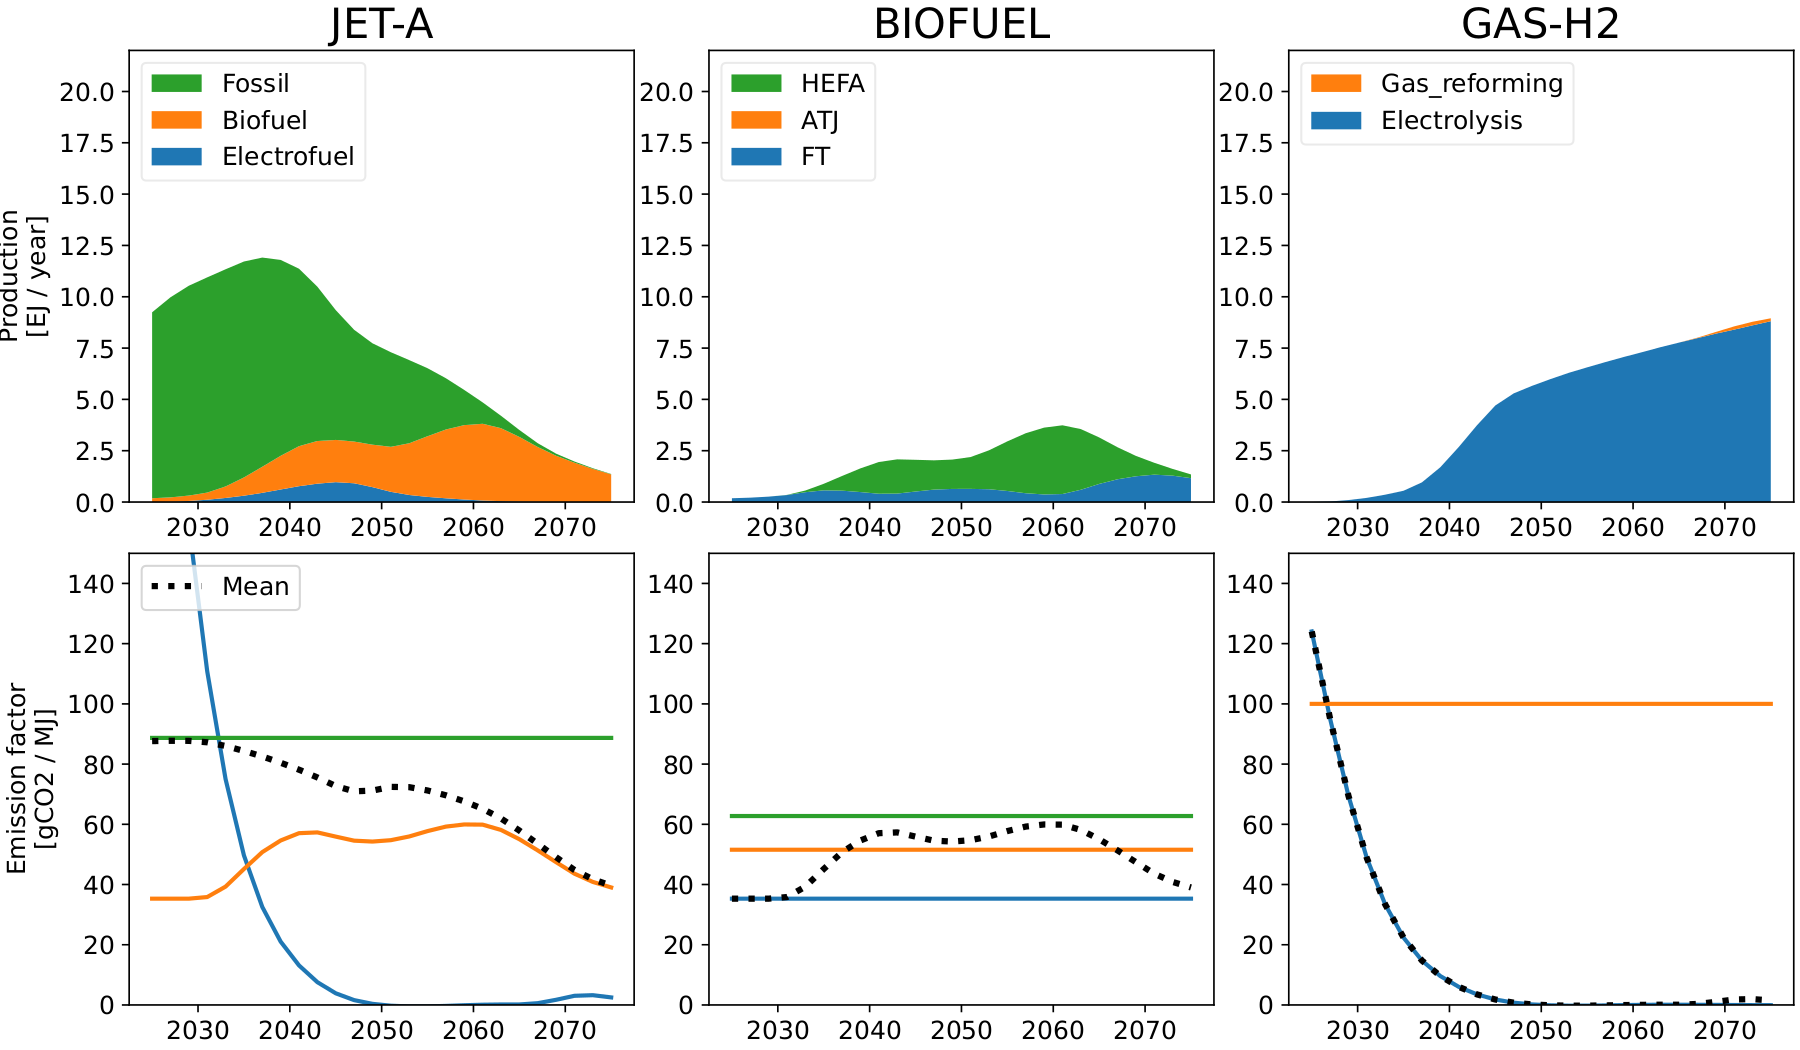
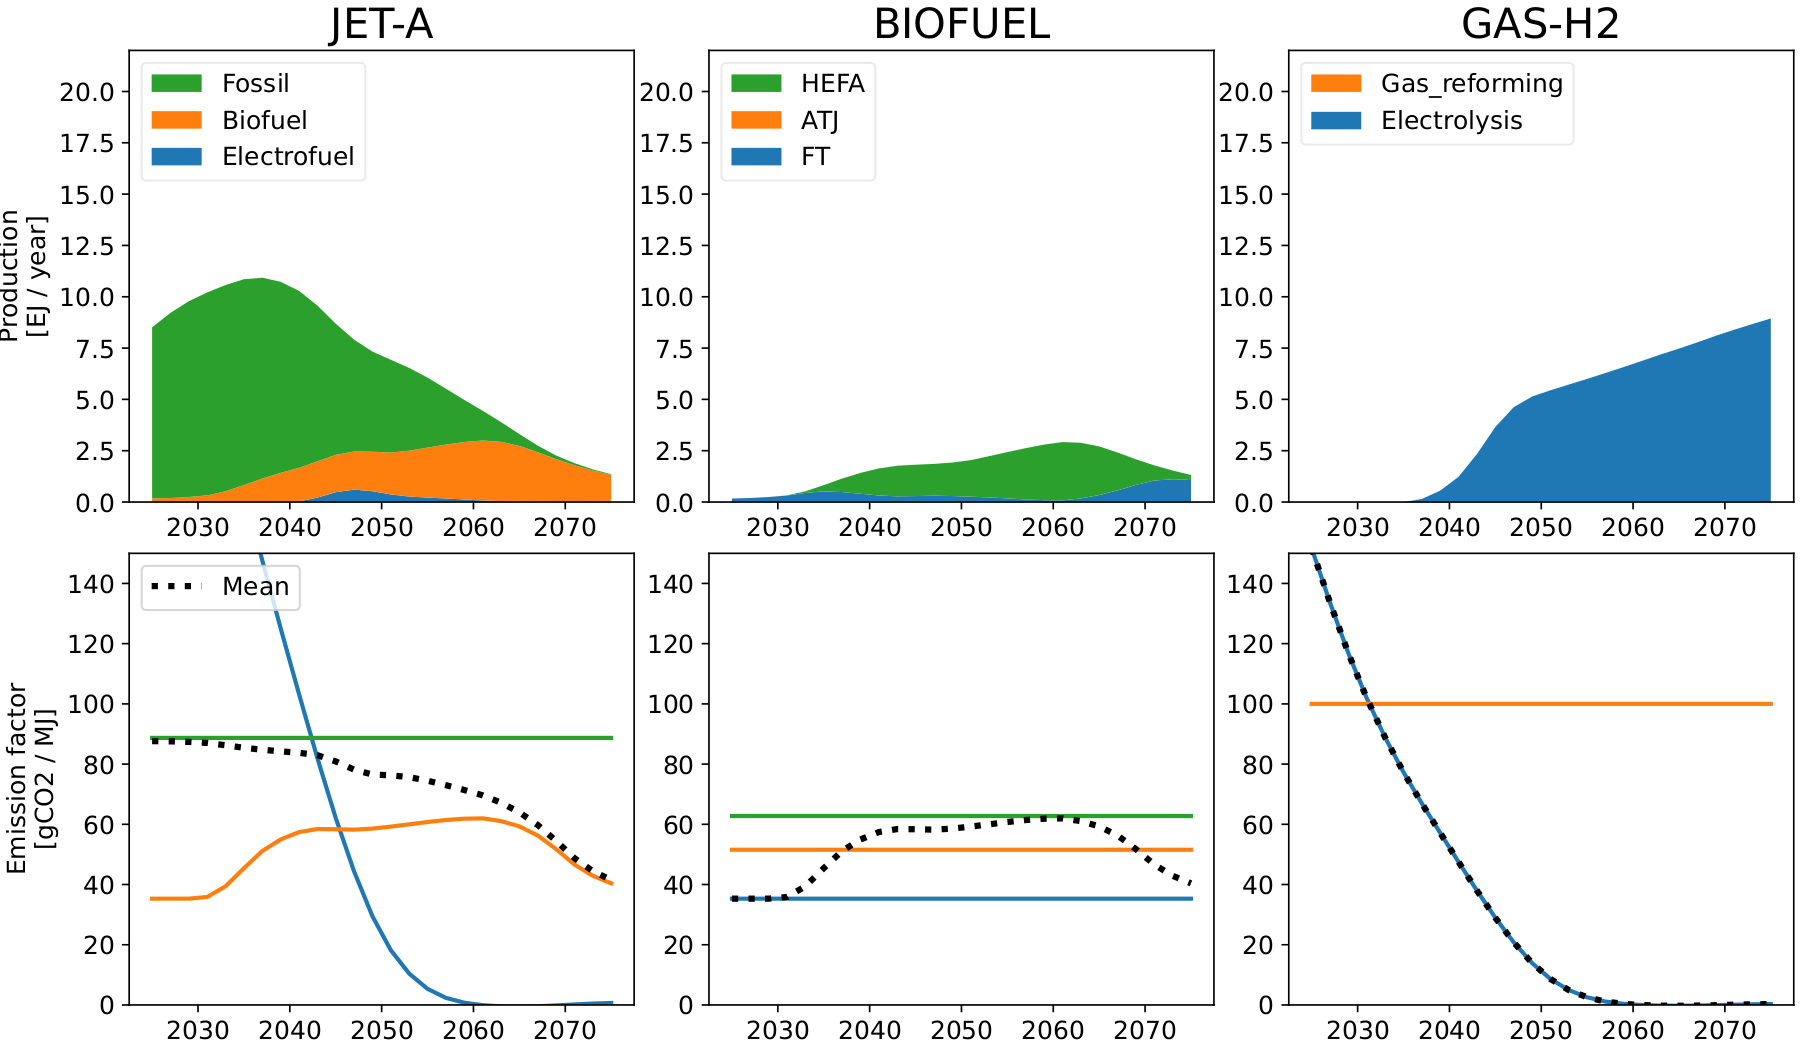
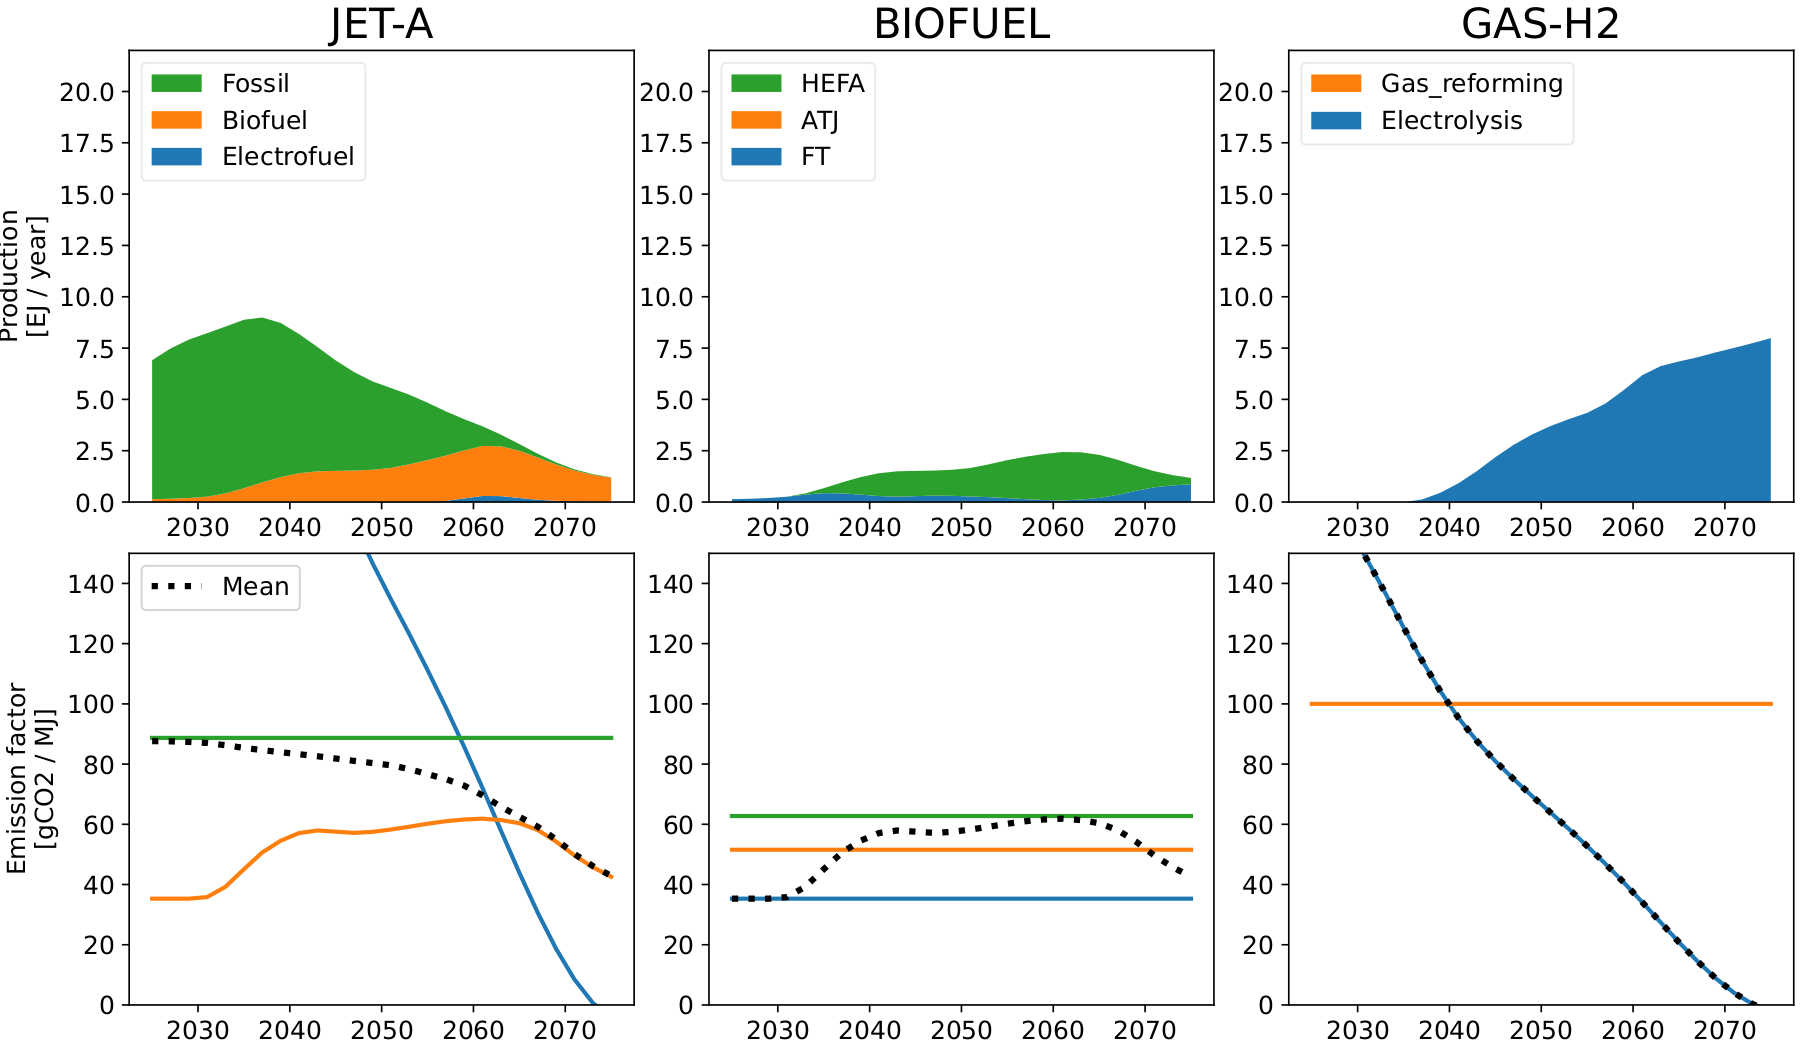
As the SSP2-2.6 was chosen as background scenario for the single policy optimization, we include scenarios SSP2-1.9 and SSP2-3.4 in the scenario-robust optimization, to account for different radiative forcing targets, representing a more ambitious and a less ambitious scenario. The outcomes of this multi-scenario policy optimization are shown in Fig. 30, Fig. 31, and Fig. 32. Compared to the single-scenario optimum, the robust optimum display higher emissions on the target scenario SSP2-2.6, yet it allows for greater flexibility in the case an adjacent global scenario takes place. Overall, this is due to smaller shares of alternative aircraft, driven by the strong difference in the availability of electricity and emission factor associated to grid electricity among the scenarios. The overall strategy is to use the worst case scenario (higher electricity emission factor and less electricity availability) to determine the deployment of alternative aircraft, and use the surplus electricity in the other scenarios to make extra electrofuels for conventional aircraft, leaving room for more variability.
Among these three scenarios, lower warming levels lead to: earlier deployment of electrofuels due to lower electricity emission factor, higher shares of electrofuel due to the higher electricity availability, higher shares of FT pathway in the biofuel blend, and higher shares of biofuel in the Jet-A blend.
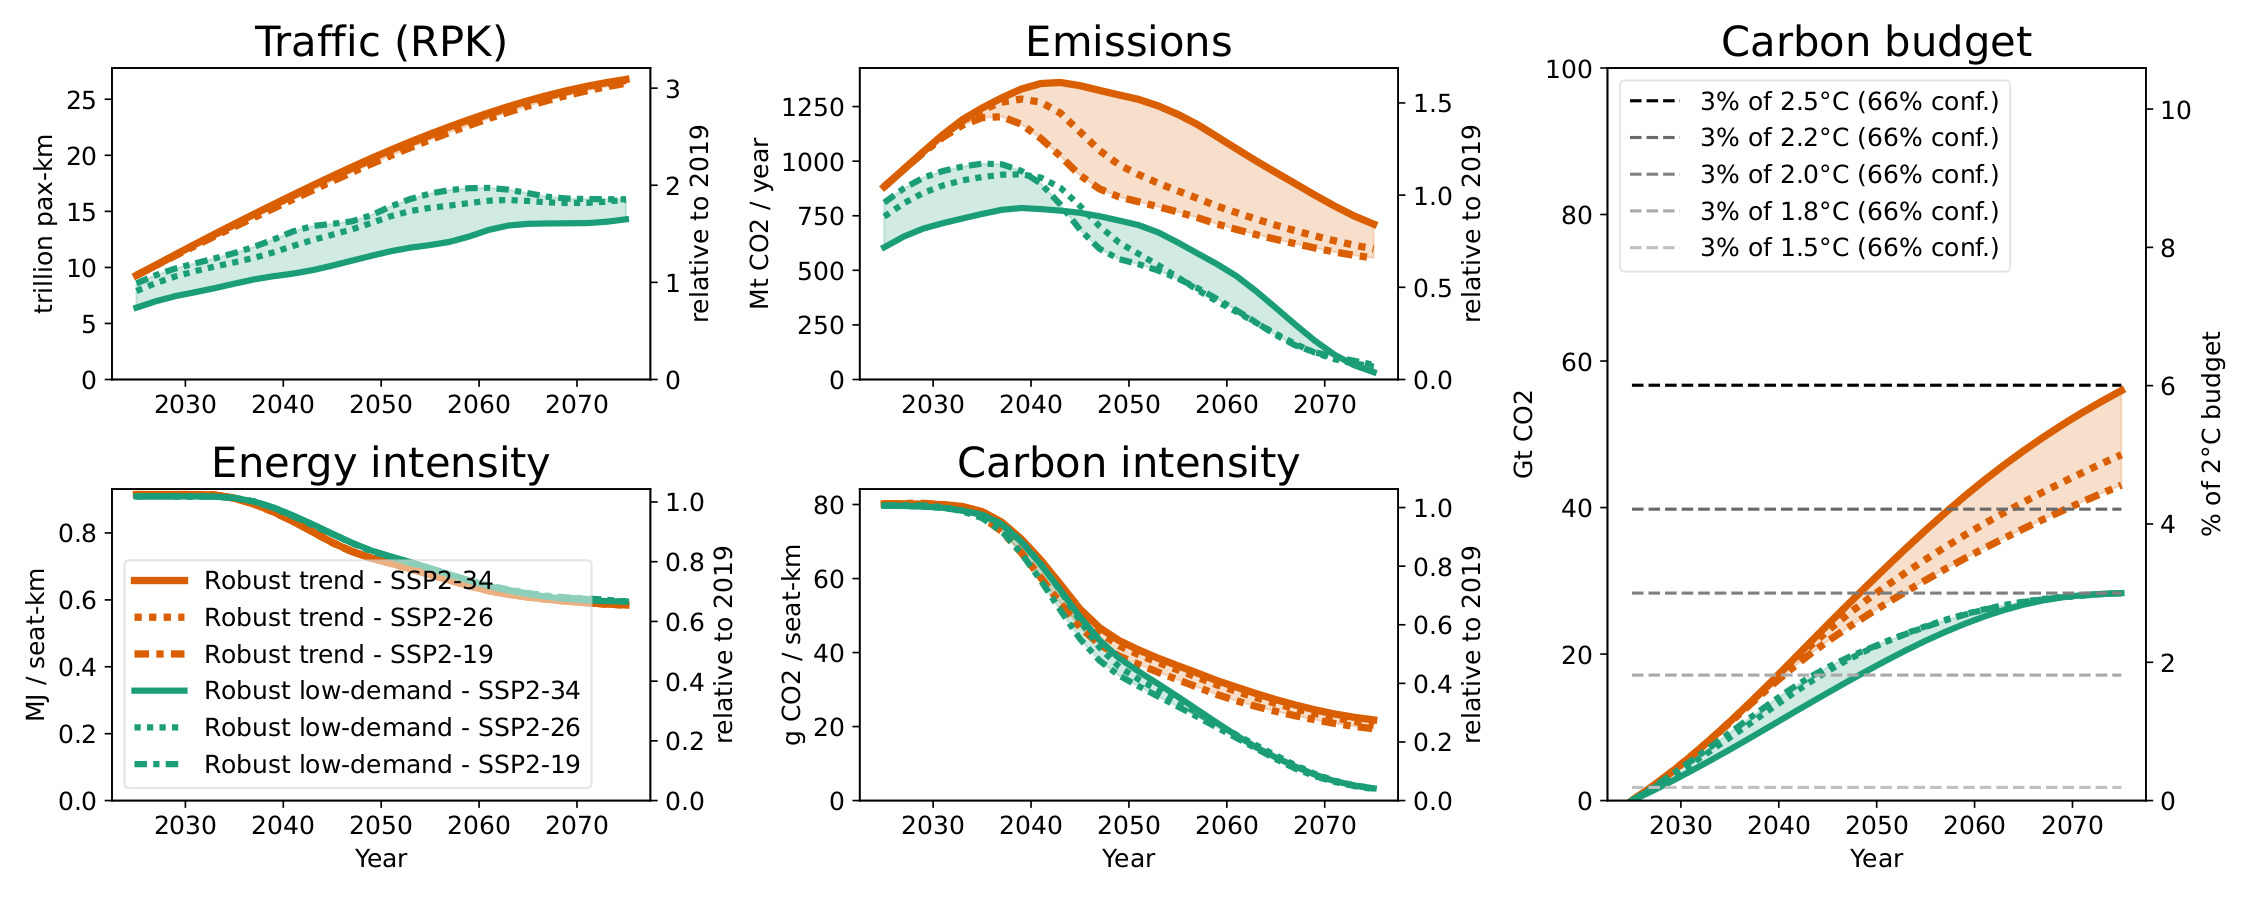
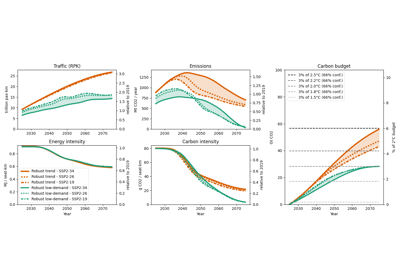
Fig. 30 Comparison of trend and low-demand scenario-robust mitigation under Mid aircraft technology and background scenarios SSP2 with RCP’s 1.9, 2.6, and 3.4. These strategies prioritizes flexibility by sizing alternative-aircraft deployment for the worst electricity conditions (SSP2-3.4), yielding higher SSP2-2.6 emissions but greater adaptability across SSP2-1.9 and SSP2-3.4.#
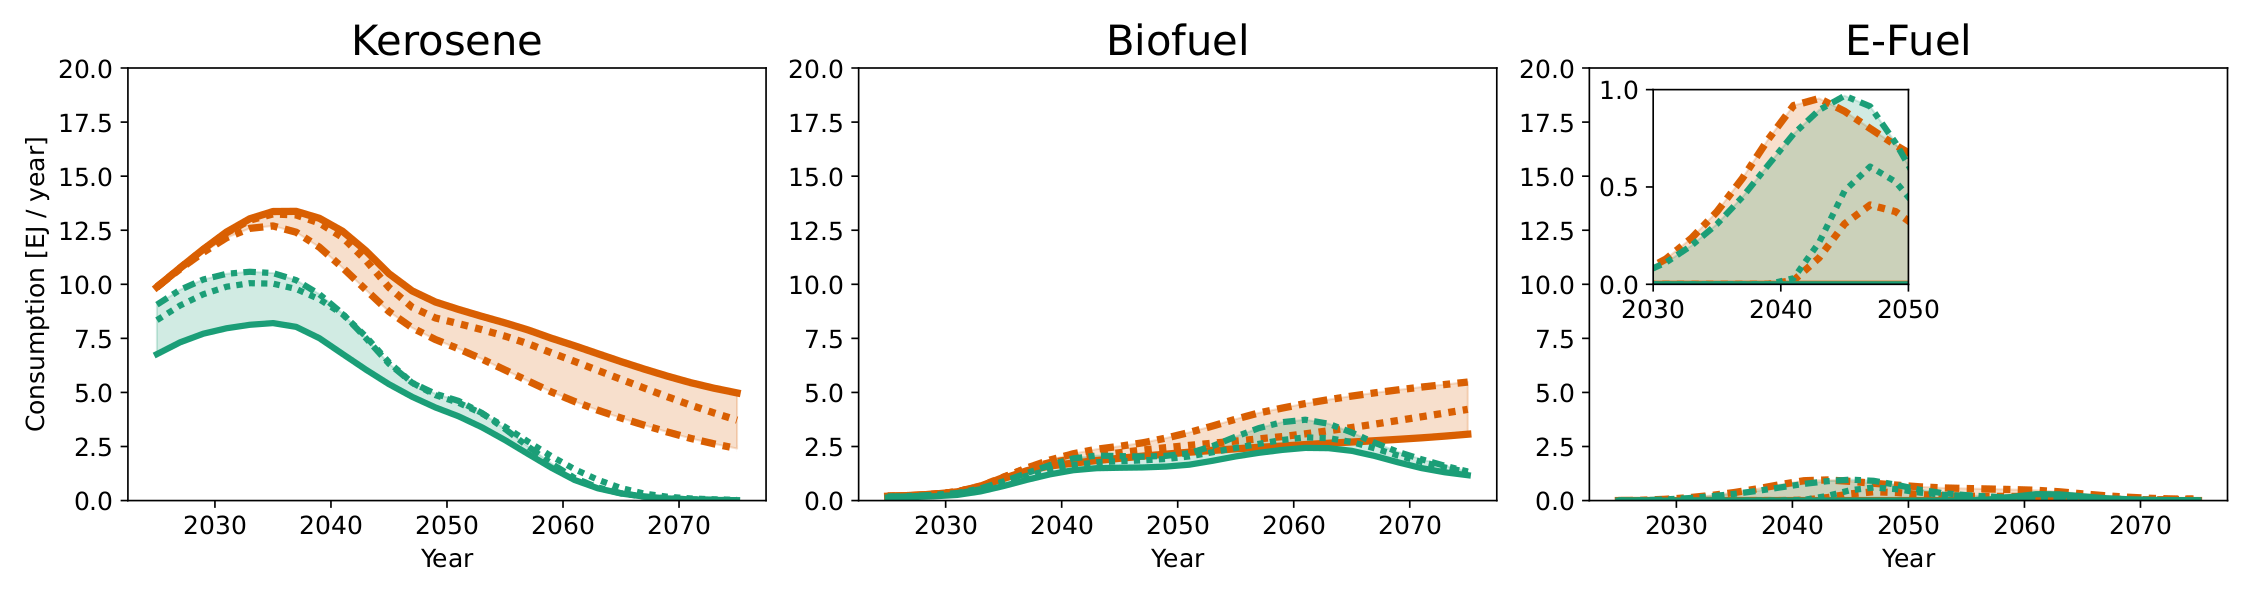
Fig. 31 Jet-A fuel blend for the scenario-robust mitigation policies (legend as in Fig. 30).#
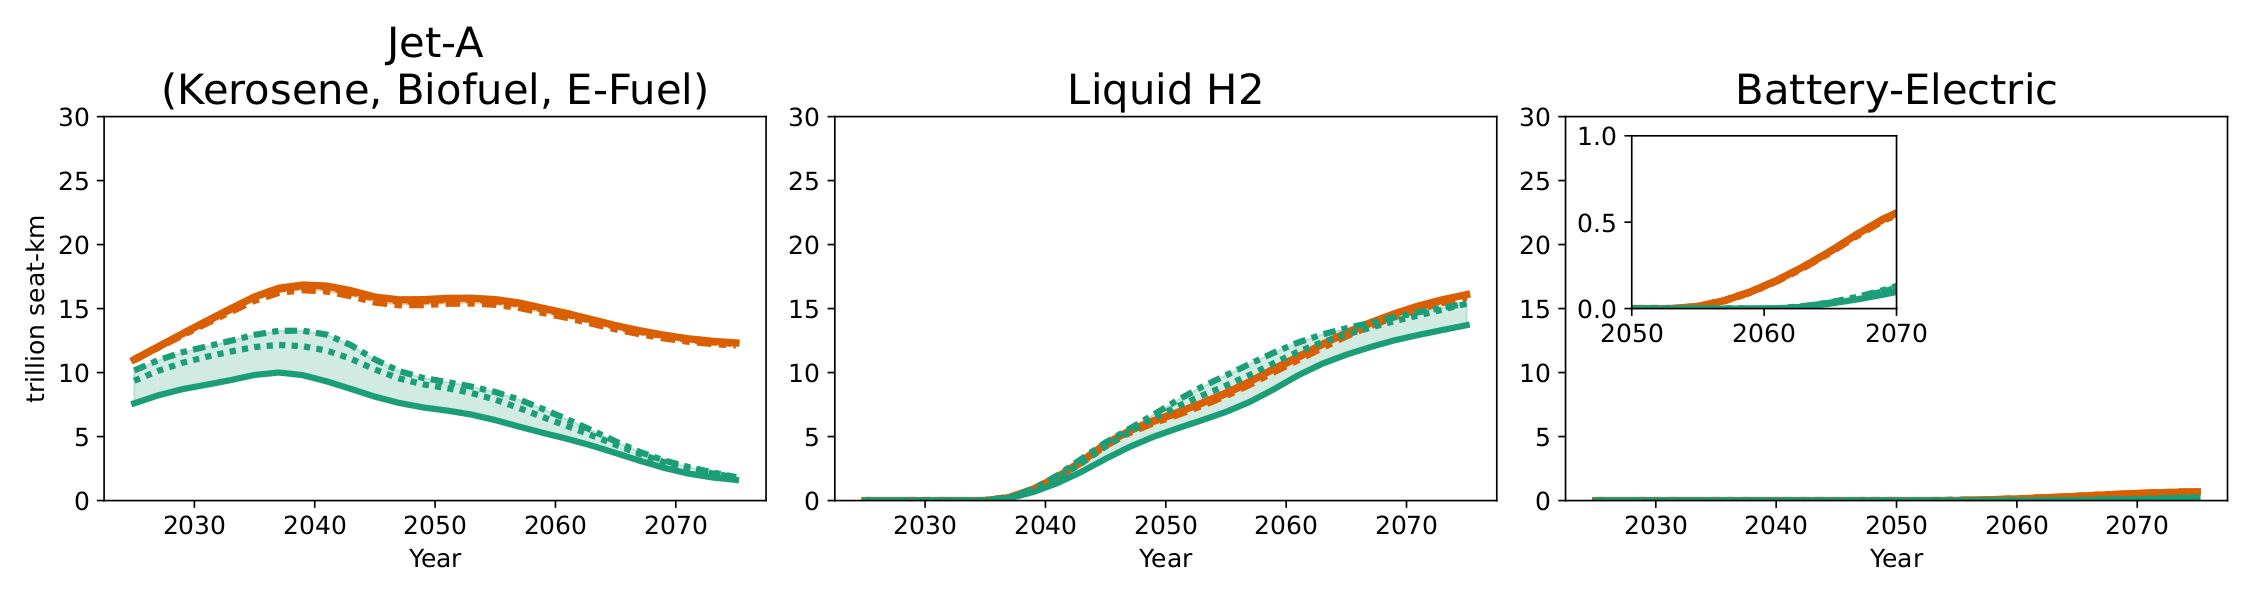
Fig. 32 Supply per final energy carrier for the scenario-robust mitigation policies (legend as in Fig. 30).#
Full results#
The complete fleet and energy-mix results per background scenario (supplementary information of the published article):
Scenario-robust trend
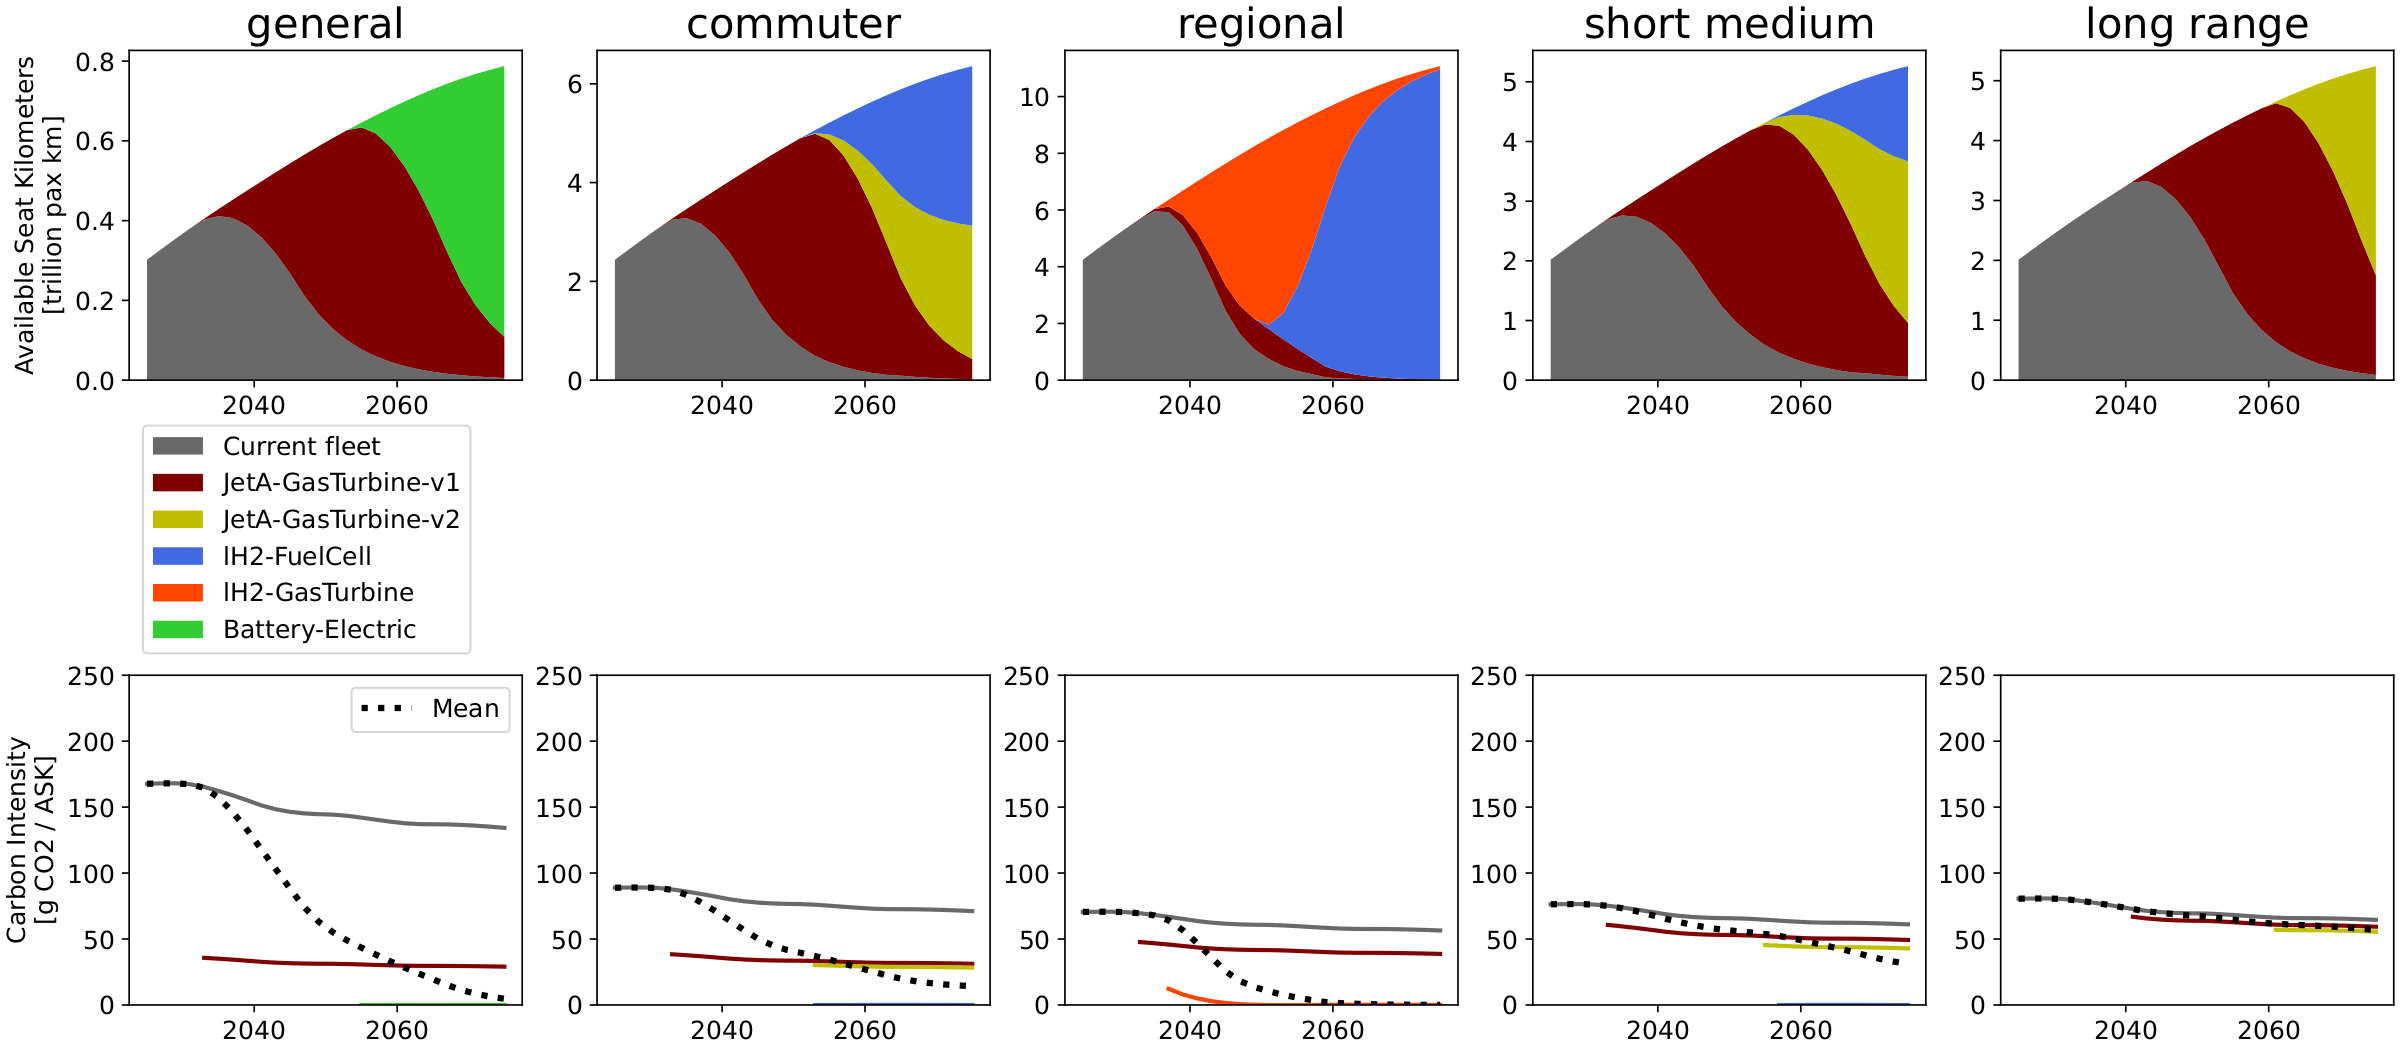
Scenario-robust low-demand
The robust optimizations and comparison figures are produced by these scripts:
Robust policy: comparison of trend vs low-demand variants

Robust policy: low-demand formulation across SSP2 variants

Robust policy: trend resource allocation across SSP2 variants