
Note
Go to the end to download the full example code.
Robust policy: comparison of trend vs low-demand variants#
from noads.application.examples import single_policy_robust_scenario_optimization
from noads.application.visualization import plot_multiple_multi_scenario_result
Robust policy comparison#
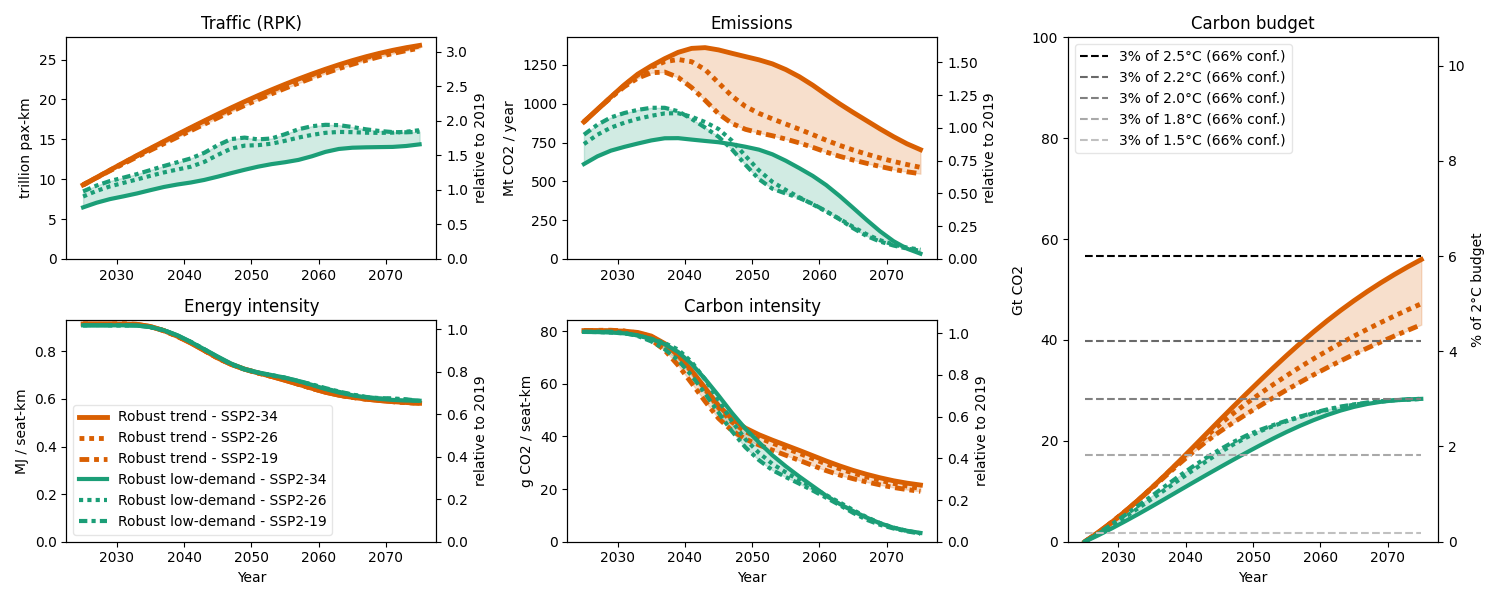
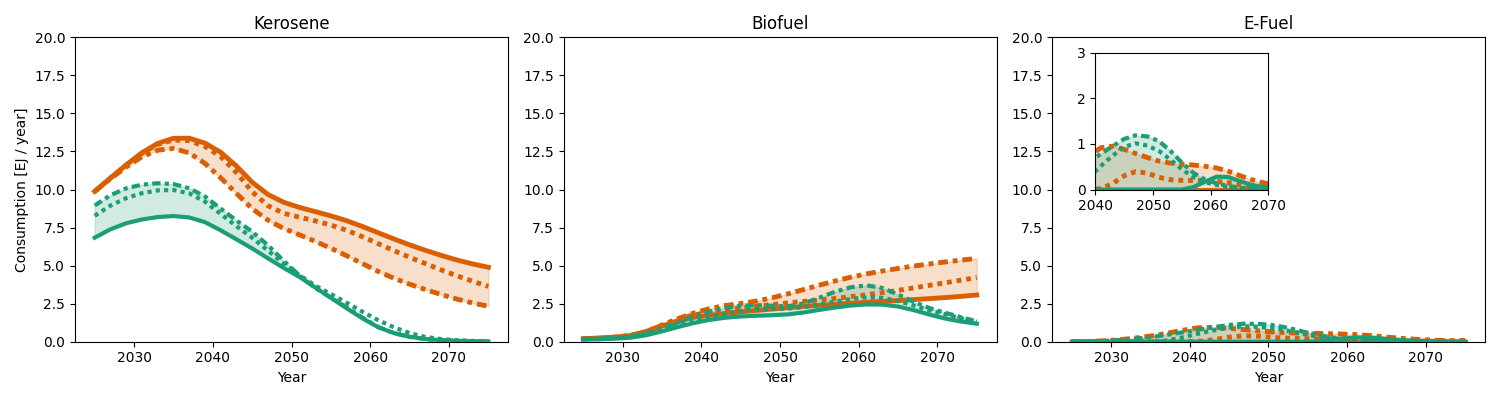
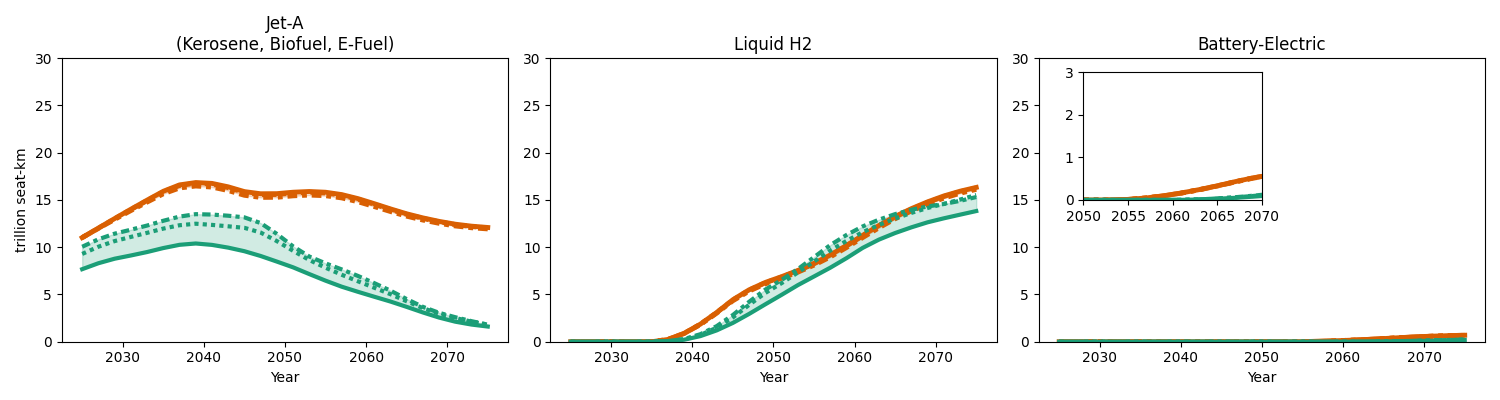
Gather results from the two robust variants (trend, low-demand) and plot multi-scenario comparisons showing how the single policy performs across all three SSP2 climate futures.
background_scenarios = ["SSP2-34", "SSP2-26", "SSP2-19"]


def load_robust_results(
    scenario_name,
    low_demand_formulation=False,
    preferential_energy=False,
):
    """Load saved robust optimization results."""
    return single_policy_robust_scenario_optimization(
        scenario_name=scenario_name,
        global_scenario_names=background_scenarios,
        carbon_budget_percent=3.0,
        technology_index=1,
        drop_in_only=False,
        low_demand_formulation=low_demand_formulation,
        preferential_energy=preferential_energy,
        load_optimum=True,
        plot_optimum=False,
        save_optimum=False,
        save_history_view=False,
        save_figs=False,
    )
Load all variants#
multi_scenario_results = {
    "Robust trend": load_robust_results("robust-SSP2"),
    "Robust low-demand": load_robust_results(
        "robust-SSP2-lowdemand",
        low_demand_formulation=True,
    ),
}
Plot multi-scenario comparison#
plot_multiple_multi_scenario_result(
    global_scenario_names=background_scenarios,
    multi_scenario_results=multi_scenario_results,
    colors=["#D95F02", "#1B9E77"],
    save_figs=False,
)
Total running time of the script: (0 minutes 1.541 seconds)