
Note
Go to the end to download the full example code.
Prospective aircraft design accounting for technology maturing#
from jax import vmap
from matplotlib.lines import Line2D
from matplotlib.patches import Patch
from matplotlib.pyplot import subplots
from numpy import array
from numpy import linspace

from noads.application.base_objects import categories_mission
from noads.application.base_objects import category_conso
from noads.application.base_objects import propulsion_architectures
from noads.application.base_objects import propulsion_mission
from noads.application.base_objects import tech_params_lower_mid_upper_2020_2040_2060
from noads.core.models.fleet.aircraft_design import AircraftDesign
from noads.core.models.fleet.aircraft_operation import AircraftOperation
from noads.core.models.fleet.aircraft_tech_parameter import AircraftTechParameter
Aircraft Technology Evolution#
Let’s start by initializing the time evolution of some key aircraft technology components, according to several literature sources.
data_sources = {
    "NASA": {
        "battery_specific_energy": array([[2035, 2040], [500, 750]]),
        "emotor_specific_power": array([[2022, 2035, 2035], [2, 13, 16]]),
        "lh2tank_gravimetric_index": array([[], []]),
        "fuelcell_specific_power": array([[], []]),
        "fuelcell_efficiency": array([[2035], [55.2]]),
        "electronics_specific_power": array([[2035, 2040, 2050], [13, 19, 26]]),
        "struct_weight_factor": array([[], []]),
    },
    "IATA": {
        "battery_specific_energy": array([[2020, 2030, 2035], [200, 225, 400]]),
        "emotor_specific_power": array([[], []]),
        "lh2tank_gravimetric_index": array([
            [2025, 2035, 2035, 2050],
            [20, 35, 50, 70],
        ]),
        "fuelcell_specific_power": array([[2025, 2040, 2050], [4, 8, 10]]),
        "fuelcell_efficiency": array([[], []]),
        "electronics_specific_power": array([[], []]),
        "struct_weight_factor": array([
            [2030, 2030, 2030, 2030, 2030, 2050, 2050, 2050, 2050, 2050, 2050, 2050],
            [86, 80, 88, 83, 90, 80, 72, 68, 70, 83, 73, 61],
        ]),
    },
    "ATI": {
        "battery_specific_energy": array([[2025], [220]]),
        "emotor_specific_power": array([[2026, 2035, 2050], [13, 23, 25]]),
        "lh2tank_gravimetric_index": array([
            [2035, 2035, 2040, 2040, 2040, 2050, 2050, 2050],
            [47, 58, 61, 66, 72, 64, 69, 75],
        ]),
        "fuelcell_specific_power": array([
            [2025, 2030, 2035, 2050],
            [1.5, 2.0, 2.5, 5.0],
        ]),
        "fuelcell_efficiency": array([[2025, 2030, 2035, 2050], [60, 65, 70, 75]]),
        "electronics_specific_power": array([[2026, 2030, 2050], [8.92, 20, 30]]),
        "struct_weight_factor": array([[2025, 2030, 2035, 2050], [80, 75, 70, 60]]),
    },
    "ICCT": {
        "battery_specific_energy": array([[2025, 2030, 2050], [250, 300, 500]]),
        "emotor_specific_power": array([[], []]),
        "lh2tank_gravimetric_index": array([[2035, 2035], [20, 35]]),
        "fuelcell_specific_power": array([[2035, 2035], [1, 2]]),
        "fuelcell_efficiency": array([[2035, 2035], [45, 65]]),
        "electronics_specific_power": array([[2025], [8]]),
        "struct_weight_factor": array([[], []]),
    },
    "EASA": {
        "battery_specific_energy": array([[2022], [210]]),
        "emotor_specific_power": array([[2022, 2022], [57.6 / 22.7, 73.5 / 56.6]]),
        "lh2tank_gravimetric_index": array([[], []]),
        "fuelcell_specific_power": array([[], []]),
        "fuelcell_efficiency": array([[], []]),
        "electronics_specific_power": array([[], []]),
        "struct_weight_factor": array([[], []]),
    },
    "Adler et al. (2025)": {
        "battery_specific_energy": array([[2023, 2030], [300, 600]]),
        "emotor_specific_power": array([[2025], [8]]),
        "lh2tank_gravimetric_index": array([[2035], [50]]),
        "fuelcell_specific_power": array([[2035, 2050], [2, 6]]),
        "fuelcell_efficiency": array([[2035, 2050], [60, 75]]),
        "electronics_specific_power": array([[], []]),
        "struct_weight_factor": array([[], []]),
    },
}
markers_sources = {
    "NASA": "o",
    "IATA": "s",
    "ATI": "d",
    "ICCT": "X",
    "EASA": "*",
    "Adler et al. (2025)": "P",
}
units = {
    "battery_specific_energy": "Wh/kg",
    "emotor_specific_power": "kW/kg",
    "electronics_specific_power": "kW/kg",
    "fuelcell_specific_power": "kW/kg",
    "lh2tank_gravimetric_index": "%",
    "fuelcell_efficiency": "%",
    "struct_weight_factor": "%",
}
name_to_fullname = {
    "battery_specific_energy": "Battery Specific Energy",
    "emotor_specific_power": "E-motor Specific Power",
    "electronics_specific_power": "Power electronics Specific Power",
    "fuelcell_specific_power": "Fuel cell Specific Power",
    "lh2tank_gravimetric_index": "LH2 tank Gravimetric Index",
    "fuelcell_efficiency": "Fuel cell Efficiency",
    "struct_weight_factor": "Structural weight reduction",
}
propulsion_colors = {
    "JetA-GasTurbine": "maroon",
    "Battery-Electric": "limegreen",
    "lH2-FuelCell": "royalblue",
    "lH2-GasTurbine": "orangered",
}
Now let’s visualize how the Technology Evolution scenarios compare with these sources.
years = linspace(2020, 2060, 41)
fig1, axes1 = subplots(
    2,
    4,
    figsize=(12, 7),
    layout="constrained",
)
tech_params = {}
for i, (name, values) in enumerate(tech_params_lower_mid_upper_2020_2040_2060.items()):
    lower, mid, upper = values
    lower_param = AircraftTechParameter(name, (lower[0], lower[1], lower[2]))
    mid_param = AircraftTechParameter(name, (mid[0], mid[1], mid[2]))
    upper_param = AircraftTechParameter(name, (upper[0], upper[1], upper[2]))
    tech_params[name] = (lower_param, mid_param, upper_param)

    lower_values = lower_param.value_at_entry_into_service(years)
    mid_values = mid_param.value_at_entry_into_service(years)
    upper_values = upper_param.value_at_entry_into_service(years)

    ax = axes1.flat[i]
    ax.fill_between(
        years,
        lower_values,
        upper_values,
        alpha=0.2,
        color="k",
        label="Upper-to-Lower",
    )
    ax.plot(years, lower_values, "k-", linewidth=2, label="Lower")
    ax.plot(years, mid_values, "k:", linewidth=2, label="Mid")
    ax.set_title(name_to_fullname[name], fontsize="medium")
    ax.set_ylabel(units[name])
    ax.set_xlabel("Year")
    for source, source_data in data_sources.items():
        x_data = source_data[name][0]
        y_data = source_data[name][1]
        ax.plot(
            x_data,
            y_data,
            markers_sources[source],
            label=source,
            markersize=8,
        )

# axes1[0, 0].legend(loc="upper left", framealpha=0.4)
axes1[-1, -1].clear()
axes1[-1, -1].set_axis_off()

legend_handles = [
    Line2D([0], [0], color="k", ls="-", lw=2, label="Lower"),
    Line2D([0], [0], color="k", ls=":", lw=2, label="Mid"),
    Patch(alpha=0.2, facecolor="k", label="Upper-to-Lower"),
]
legend_handles.extend([
    Line2D([0], [0], ls="None", marker=marker, markersize=8, label=name, color=f"C{j}")
    for j, (name, marker) in enumerate(markers_sources.items())
])

axes1[-1, -1].legend(handles=legend_handles, loc="center")


fig1.suptitle(
    "Aircraft Technology Parameters evolution",
    fontsize="large",
)
fig1.savefig("./aircraft_technology.pdf")
print(
    "Aircraft technology parameters evolution figure saved as 'aircraft_technology.pdf'"
)
# show()
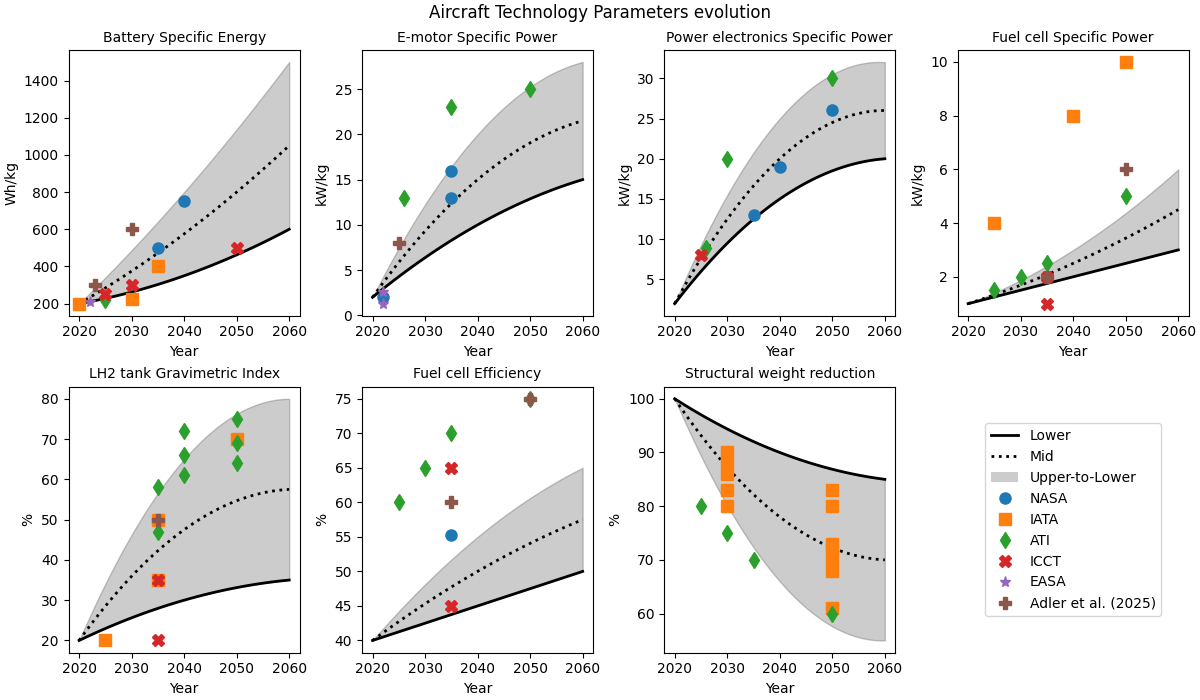
Aircraft technology parameters evolution figure saved as 'aircraft_technology.pdf'
Prospective Aircraft Design#
Now for each year of Entry-Into-Service we’ll design an airplane using GAM and compare their overall empty weight and mission energy consumption.
Unfeasible designs may yield infinite mass and energy, therefore the (mass/energy) metric is calculated on a per (seat-km) basis and then inverted. They are therefore a measure of traffic per (mass/energy). The highest the metric the lower the (mass/energy).
fig2, axes2 = subplots(2, 3, layout="constrained", figsize=(12, 8))
fig2.suptitle("Aircraft Energy Efficiency\n[seat km / MJ]", fontsize="x-large")

fig3, axes3 = subplots(2, 3, layout="constrained", figsize=(12, 8))
fig3.suptitle("Aircraft Empty-Mass Efficiency\n[seat km / kg]", fontsize="x-large")

categories = categories_mission.keys()
ymax = 4.0

for cat, category in enumerate(categories):
    max_range = 1e-3 * categories_mission[category]["range"]
    seat = categories_mission[category]["npax"]

    ax_e = axes2.flat[cat]
    ax_m = axes3.flat[cat]

    current_energy_per_ask = category_conso[category]
    reference_aircraft = AircraftOperation(
        name=f"{category}_RECENT",
        propulsion=None,
        energy_per_ask=current_energy_per_ask[1],
        recent=True,
    )
    ax_e.hlines(
        y=1.0 / current_energy_per_ask[0],
        xmin=years[0],
        xmax=years[-1],
        colors="dimgray",
        linestyles="-",
        linewidth=1.5,
    )
    ax_e.hlines(
        y=1.0 / current_energy_per_ask[1],
        xmin=years[0],
        xmax=years[-1],
        colors="dimgray",
        linestyles=":",
        linewidth=1.5,
    )
    ax_e.fill_between(
        [years[0], years[-1]],
        [1.0 / current_energy_per_ask[0], 1.0 / current_energy_per_ask[0]],
        [1.0 / current_energy_per_ask[2], 1.0 / current_energy_per_ask[2]],
        alpha=0.4,
        color="dimgray",
    )
    for _prop, propulsion in enumerate(propulsion_architectures.keys()):
        ask_per_energy_low_to_up = []
        ask_per_owe_low_to_up = []
        for tech_idx in range(3):
            aircraft = AircraftDesign(
                name=f"{category}_{propulsion}",
                propulsion=None,
                mission={
                    **categories_mission[category],
                    **propulsion_mission[propulsion],
                    "category": category,
                },
                power_system=propulsion_architectures[propulsion],
                aircraft_tech_params=[
                    tech_param[tech_idx]
                    for tech_name, tech_param in tech_params.items()
                ],
                reference_aircraft=reference_aircraft,
            )
            model = aircraft.design_model()
            model.discipline.jax_out_func = vmap(model.discipline.jax_out_func)
            outputs = model.discipline.execute({
                f"{category}_{propulsion}.entry_into_service": years
            })
            ask_per_energy_low_to_up.append(
                1.0 / outputs[f"{category}_{propulsion}.energy_per_ask"]
            )
            ask_per_owe_low_to_up.append(
                seat * max_range / outputs[f"{category}_{propulsion}.owe"]
            )

        ax_e.fill_between(
            years,
            ask_per_energy_low_to_up[0],
            ask_per_energy_low_to_up[-1],
            alpha=0.2,
            color=propulsion_colors[propulsion],
        )
        ax_e.plot(
            years,
            ask_per_energy_low_to_up[0],
            color=propulsion_colors[propulsion],
            linestyle="-",
            linewidth=3,
        )
        ax_e.plot(
            years,
            ask_per_energy_low_to_up[1],
            color=propulsion_colors[propulsion],
            linestyle=":",
            linewidth=3,
        )

        ax_m.fill_between(
            years,
            ask_per_owe_low_to_up[0],
            ask_per_owe_low_to_up[-1],
            alpha=0.2,
            color=propulsion_colors[propulsion],
        )
        ax_m.plot(
            years,
            ask_per_owe_low_to_up[0],
            color=propulsion_colors[propulsion],
            linestyle="-",
            linewidth=3,
        )
        ax_m.plot(
            years,
            ask_per_owe_low_to_up[1],
            color=propulsion_colors[propulsion],
            linestyle=":",
            linewidth=3,
        )

    ax_e.set_ylim(ymin=0.0, ymax=ymax)
    ax_e.set_title(
        f"{category.replace('_', ' ')}\n({seat} seat, {max_range} km)",
        fontsize="large",
    )
    ax_m.set_ylim(ymin=0.0)
    ax_m.set_title(
        f"{category.replace('_', ' ')}\n({seat} seat, {max_range} km)",
        fontsize="large",
    )

axes2[-1, -1].clear()
axes2[-1, -1].set_axis_off()
axes3[-1, -1].clear()
axes3[-1, -1].set_axis_off()

# Manually add legend

handles = [
    Patch(color=color, label=prop_name)
    for prop_name, color in propulsion_colors.items()
]
handles.append(Patch(color="dimgray", label="Current Technology"))

axes2[-1, -1].legend(
    handles=handles,
    loc="center",
)
axes2[-1, 0].set_xlabel("Entry-Into-Service")

axes3[-1, -1].legend(
    handles=[
        Patch(color=color, label=prop_name)
        for prop_name, color in propulsion_colors.items()
    ],
    loc="center",
)
axes3[-1, 0].set_xlabel("Entry-Into-Service")

fig2.savefig("./aircraft_prospective_energy.pdf")
fig3.savefig("./aircraft_prospective_mass.pdf")
print(
    "Figures saved as aircraft_prospective_energy.pdf and aircraft_prospective_mass.pdf"
)

# show()
![Aircraft Energy Efficiency [seat km / MJ], general (19 seat, 500.0 km), commuter (50 seat, 1500.0 km), regional (80 seat, 4500.0 km), short medium (120 seat, 8000.0 km), long range (250 seat, 15000.0 km)](../../../_images/sphx_glr_plot_prospective_aircraft_002.png)
![Aircraft Empty-Mass Efficiency [seat km / kg], general (19 seat, 500.0 km), commuter (50 seat, 1500.0 km), regional (80 seat, 4500.0 km), short medium (120 seat, 8000.0 km), long range (250 seat, 15000.0 km)](../../../_images/sphx_glr_plot_prospective_aircraft_003.png)
Figures saved as aircraft_prospective_energy.pdf and aircraft_prospective_mass.pdf
Total running time of the script: (1 minutes 1.288 seconds)