
Note
Go to the end to download the full example code.
Baseline comparison across SSP pathways#
from noads.application.examples import single_policy_scenario_optimization
from noads.application.visualization import plot_tech_scenarios_trends
Cross-scenario baseline comparison#
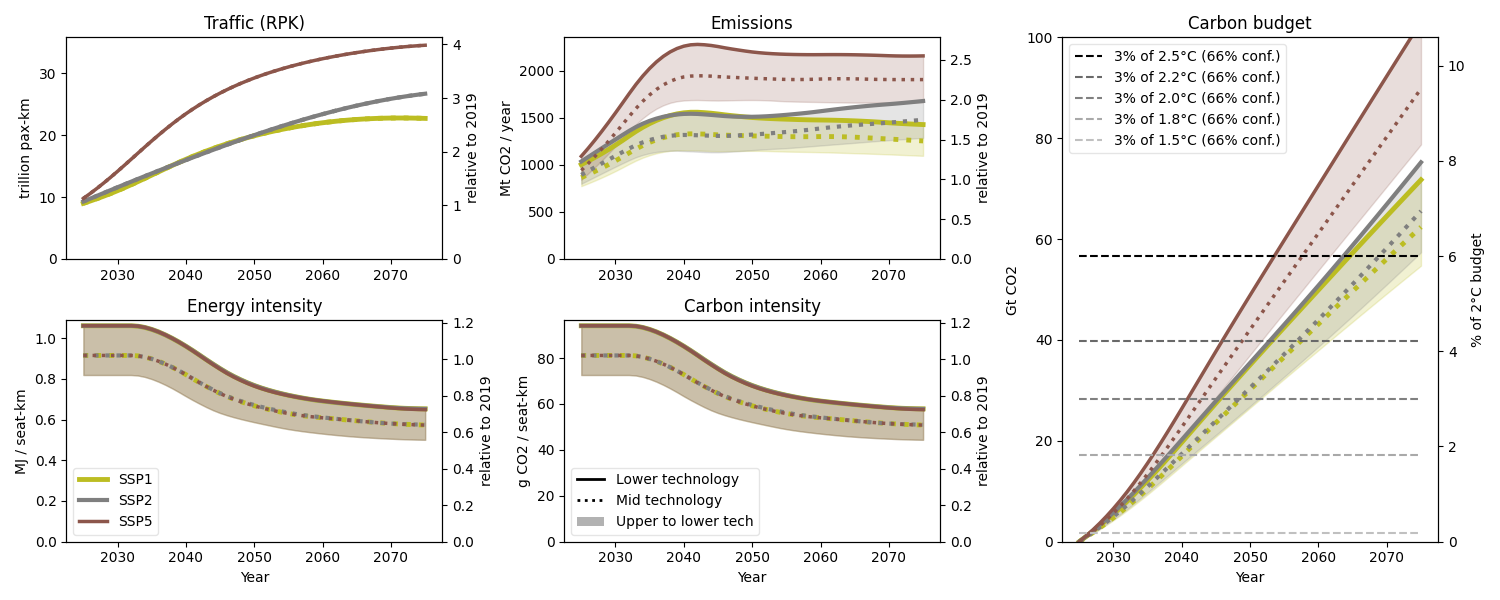
Gather baseline (fossil kerosene only) results from all three SSP pathways and three technology levels, then plot the technology scenario trends side-by-side. This shows how emissions, final energy, and cost differ across climate futures when no mitigation action is taken.
def load_baseline_results(global_scenario_name, technology_index):
    """Load previously saved baseline optimization results."""
    return single_policy_scenario_optimization(
        global_scenario_name=global_scenario_name,
        carbon_budget_percent=3.0,
        technology_index=technology_index,
        drop_in_only=True,
        fossil_kerosene_only=True,
        low_demand_formulation=False,
        preferential_energy=False,
        load_optimum=True,
        plot_optimum=False,
        save_optimum=False,
        save_figs=False,
        save_history_view=False,
    )
Load results for each background scenario#
background_scenarios = ["SSP1-19", "SSP2-26", "SSP5-45"]
scenario_outputs = {}

for scenario in background_scenarios:
    outputs_per_tech = [
        load_baseline_results(scenario, tech_idx) for tech_idx in range(3)
    ]
    scenario_outputs[scenario.split("-")[0]] = outputs_per_tech
Plot comparison#
plot_tech_scenarios_trends(
    scenario_outputs=scenario_outputs,
    colors=["#BCBD22", "#7F7F7F", "#8C564B"],
    save_fig=False,
)
Total running time of the script: (0 minutes 0.830 seconds)